Fig. 3.
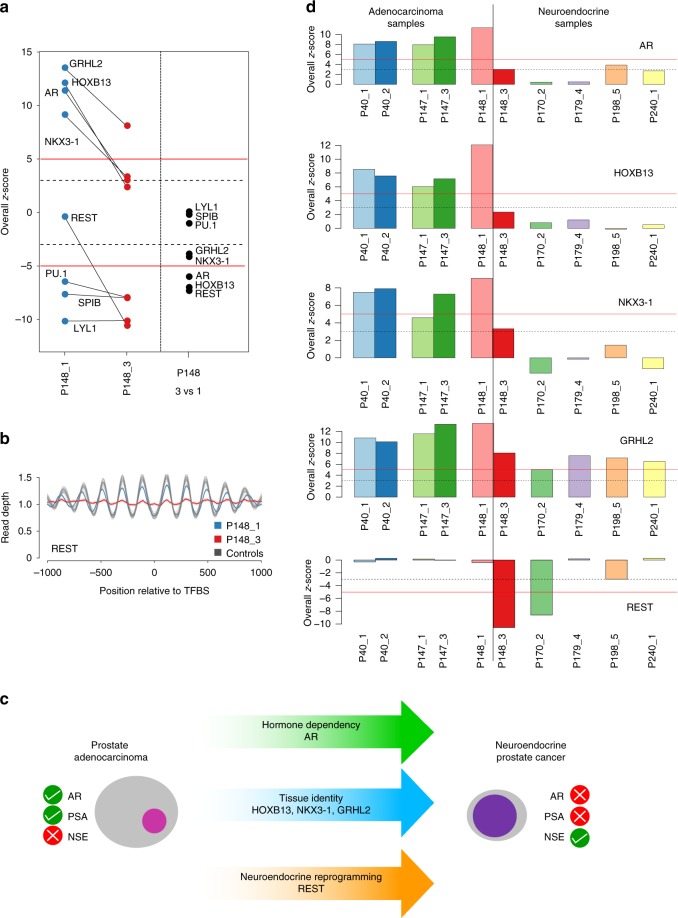
Prostate lineage-specific TFs, their plasticity and suitability for tumor classification. a Left panel: z-score plots of P148_1 and P148_3 showing drastic accessibility reductions for TFs GRHL2, HOXB13, AR, NKX3-1, and REST whereas the accessibility of hematopoietic TFs PU.1, SPIB, and LYL1 remained unchanged. The right panel displays the z-scores for the pairwise comparison between P148_3 and P148_1. In this pairwise comparison, the hematopoietic TFs had a z-score around 0, whereas GRHL2 and NKX3-1 exceeded −3 and AR, HOXB13, and REST exceeded −5 thresholds. b Nucleosome position profiles for TF REST illustrating compared with normal samples a similar accessibility of REST in P148_1 (blue), but a drastic reduction of accessibility in plasma sample P148_3 (red). c Prostate adenocarcinomas are AR-dependent and accordingly have frequently increased PSA (prostate-specific antigen) levels and normal NSE (neuron-specific enolase) values. In contrast, t-SCNC are no longer dependent on AR and usually have low PSA and increased NSE levels. Several TFs involved in the transdifferentiation process from an adenocarcinoma to a t-SCNC have been identified and are indicated in the arrows. d Bar charts of overall z-score plots for TFs AR, HOXB13, NKX3-1, GRHL2, and REST for prostate adenocarcinomas (left) and prostate neuroendocrine cancer (right). Bars represent single data points

