Fig. 3.
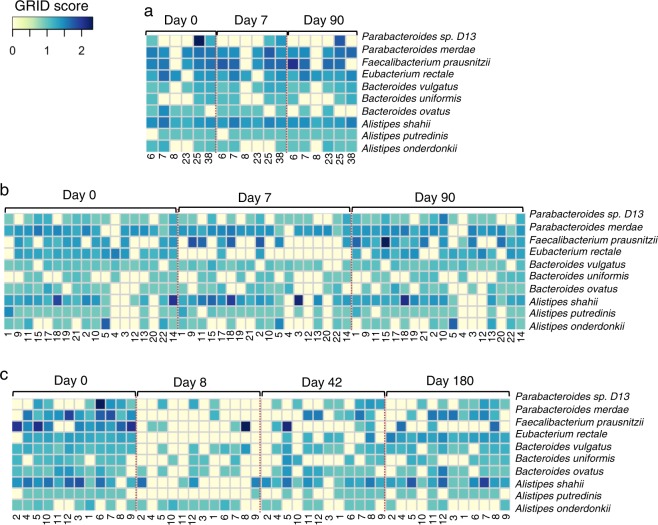
Microbe replication. Heatmap representing the Growth Rate InDex (GRiD)16 scores for the top 10 species that were abundant across all individuals (n = 36) determined at each time point for all individuals from the three data sets; a control and b single antibiotic data sets from Raymond et al., and c multiple antibiotics data set from Palleja et al. The heatmap was generated using the heatmap.2 function in R (version 3.5.1). Each number shown below the heatmap corresponds to the individual listed in Supplementary Data 1. The larger GRiD scores indicate a higher growth rate represented in dark blue, and the smaller GRiD scores represent a lower growth rate shown in light yellow (values <1.5 generally slow-growing microbes16). GRiD scores for all identified bacterial genomes as well as common species across all data sets were elaborated in Supplementary Data 1 and Supplementary Fig. 6, respectively. Significant differences (P value < 0.05) of the GRiD scores of the top 10 species between different time points, particularly Day 0 vs. the last day of the post-treatment sample in each data set were tested using an ANOVA followed by Tukey’s multiple-comparisons post hoc tests in R (version 3.5.1), showing no significant differences (P value >0.05) between Day 0 and Day 90 in both the control and single antibiotic data sets (see detailed values in Supplementary Data 1). Similarly, the multiple antibiotics data set showed no significant differences (P value >0.05) between Day 0 and Day 180 for the majority of species (9 out of 10 species; see detailed values in Supplementary Data 1)

