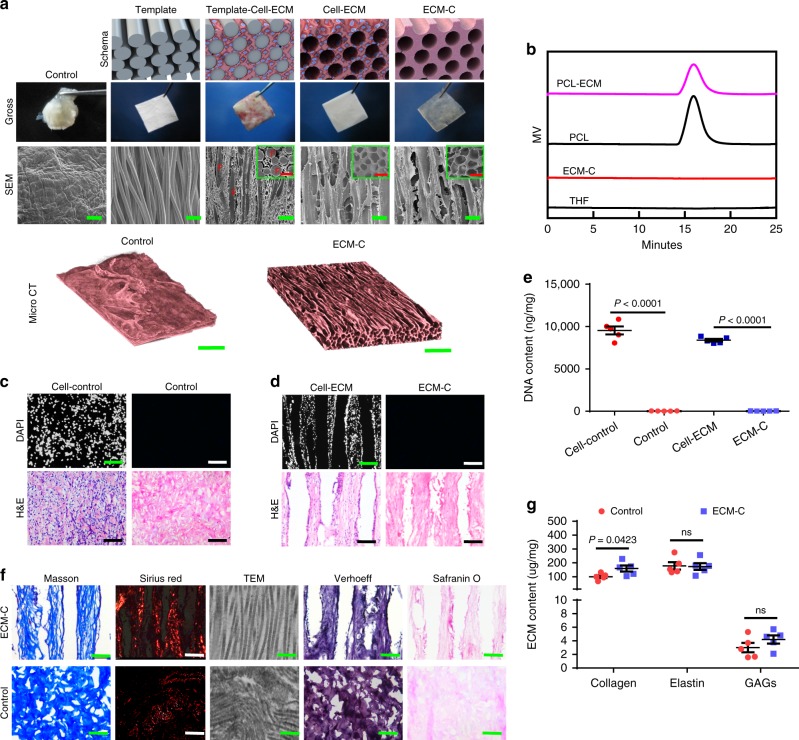
Fig. 2.
Fabrication and characterisation of ECM-C and control scaffolds. a The schematic diagram, gross morphology (optical imaging) and the microstructure (SEM) of PCL fibre template, template-cell-ECM, cell-ECM, ECM-C and control group during the preparation process; micro-computed tomography (microCT) showing three-dimensional macro and micro structure of ECM-C and control scaffolds. Inset: SEM examination of the transverse sections. F indicates the PCL microfiber. b Gel permeation chromatography analysis showing complete removal of PCL. c, d DAPI and H&E staining of undecellularized control, control scaffolds, cell-ECM composite, and ECM-C scaffolds. e DNA contents of cell-ECM composite, ECM-C, undecellularized control and control group, the samples were treated with 1% SDS containing DNase and RNase (n = 5). f Masson trichrome staining, Sirius red staining, TEM, Verhoeff and safranin O staining showed the ECM components including collagen, elastin and glycosaminoglycan in ECM-C and control scaffolds. g Comparison of ECM contents between ECM-C and control group including collagen, elastin and glycosaminoglycans (n = 5). Bar heights and error bars represent means ± s.e.m. (t-test). Statistical analysis (ns = no significance). Scale bars: a, SEM images: 300 μm; Micro CT image: 500 μm; c, d, 100 μm; f, histology panels: 100 µm; TEM image: 200 nm

