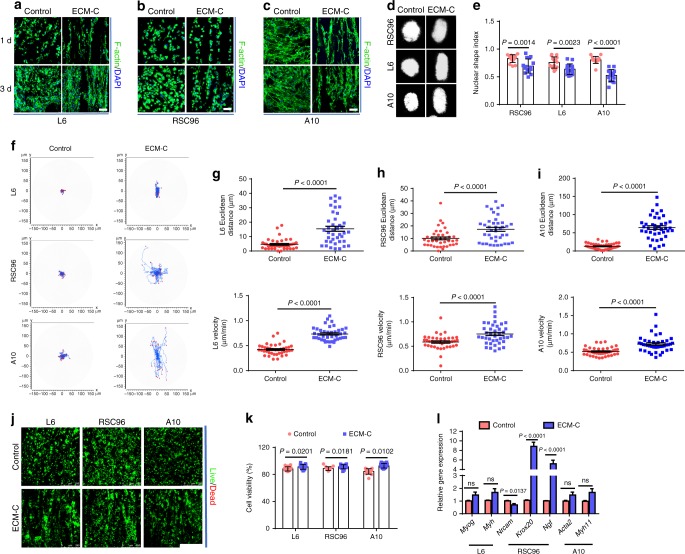
Fig. 3.
Cellular guiding effects of ECM-C and control scaffolds. a–c Skeletal actin fibres and nuclei of L6, RSC96 and A10 cells were respectively stained with fluorescein isothiocyanate (FITC) conjugated phalloidin and DAPI at 1 and 3 days. d Typical images of L6, RSC96 and A10 cells nuclei stained by DAPI. e The nuclear shape index of L6, RSC96 and A10 cells on different scaffolds (n = 15). f Migration traces of L6, RSC96 and A10 cells on different scaffolds. At least 40 cells were tracked for each group. g–i Euclidean distance and velocity of L6, RSC96 and A10 cells on different scaffolds (n = 45). j, k Live/dead staining and cell viability of L6, RSC96 and A10 cells on different scaffolds at 7 days. Live cells stained green and dead cells stained red (n = 15). l Real-time PCR analysis of Myog (myogenin) and Myh (myosin heavy chain), gene expression of L6 cells, Nrcam (neuronal cellular adhesion molecules), Krox20 (early growth response 2), Ngf (nerve growth factor) gene expressions of RSC96 cells, Acta2 (α-smooth muscle actin) and Myh11 (smooth muscle myosin heavy chain) gene expression of A10 cells on different scaffolds after culture for 7 days (n = 5). Images and data are representative of n = 3 individual experiments, and bar heights and error bars represent means ± s.e.m. (t-test). Statistical analysis (ns = no significance). Scale bars: a–c, 50 μm, j, 250 μm

