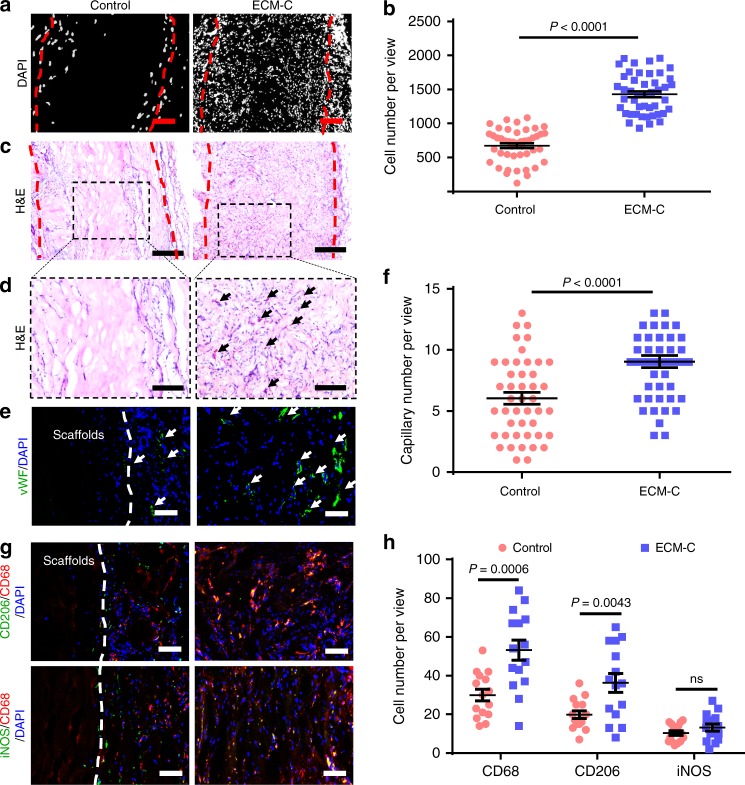
Fig. 4.
Cell infiltration, vascularisation and immunogenic properties of ECM-C and control scaffolds in a rat subcutaneous implantation model at 2 weeks. a DAPI staining of the cross-sections showing cell infiltration within the scaffolds. b Quantification of cells within the scaffolds (n = 45). c–e Optical images of cross-sections stained with H&E and immunofluorescently stained for vWF (green) showing cellularization and vascularisation within the scaffolds. The black and white arrows indicate the capillaries. The red dotted line indicates the edge of the scaffolds. f Quantification of capillaries within the scaffolds (n = 45). g Macrophages were detected by co-immunofluorescence staining for CD206 (green, anti-inflammatory)/CD68 (red, pan-macrophage), and iNOS (green, pro-inflammatory)/CD68 (red, pan-macrophage). White broken lines indicate the border of the scaffolds. h Quantification of CD68, CD206 and iNOS-positive cells within the scaffolds (n = 15). Images and data are representative of n = 3 individual experiments, and bar heights and error bars represent means ± s.e.m. (t-test). (n = 5 animals per group). Statistical analysis (no significance). Scale bars: a, 100 μm; c, 200 μm; d, 100 μm; e, g, 50 μm

