Fig. 5.
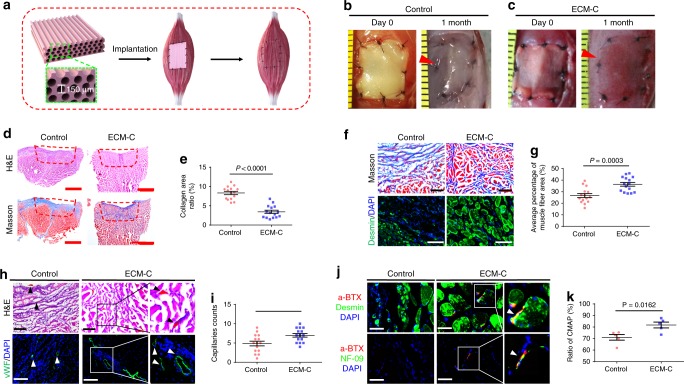
Muscle regeneration of the rat tibialis anterior (TA) muscle defects treated with ECM-C or control scaffolds. a Schematic illustration of muscle regeneration assisted by membranous ECM-C scaffolds with the microchannel diameter of ~ 150 μm. b, c Photographs of implantation and regeneration of muscle defects treated with control and ECM-C scaffolds at day 0 and 1 month, respectively. d Macroscopic view of regenerated TA muscle defects by staining the cross-sections with Masson trichrome and H&E. e Quantification of collagenous area in the cross-section of regenerated TA muscle defects (n = 15). f Microscopic images of the cross-sections of regenerated TA muscle at 1 month, stained with Masson trichrome and immunofluorescently stained for desmin. g Quantification of neo-muscle fibre per view (n = 15). h H&E staining and immunofluorescence staining of the cross-sections for vWF showing the formation of functional capillaries. Black and white triangles denote capillaries. i Number of capillaries per view (n = 15). j Demonstration of reinnervation by double immunofluorescence staining of neo-muscle fibres (desmin, green) and nicotinic acetylcholine receptors (α-bungarotoxin-tetramethylrhodamine) (α-BTX, red) or neurofilament (NF09, green) and α-BTX+ structure. White triangles indicate reinnervation within neo-muscle. k The amplitude ratio of regenerated muscle to uninjured TA muscle for the compound muscle action potentials (CMAPs) in both groups (n = 5). Bar heights and error bars represent means ± s.e.m. (t-test). (n = 5 animals per group). Scale bars: b, c, 1 mm; d, 2 mm; f, h, 100 μm; j, 50 μm

