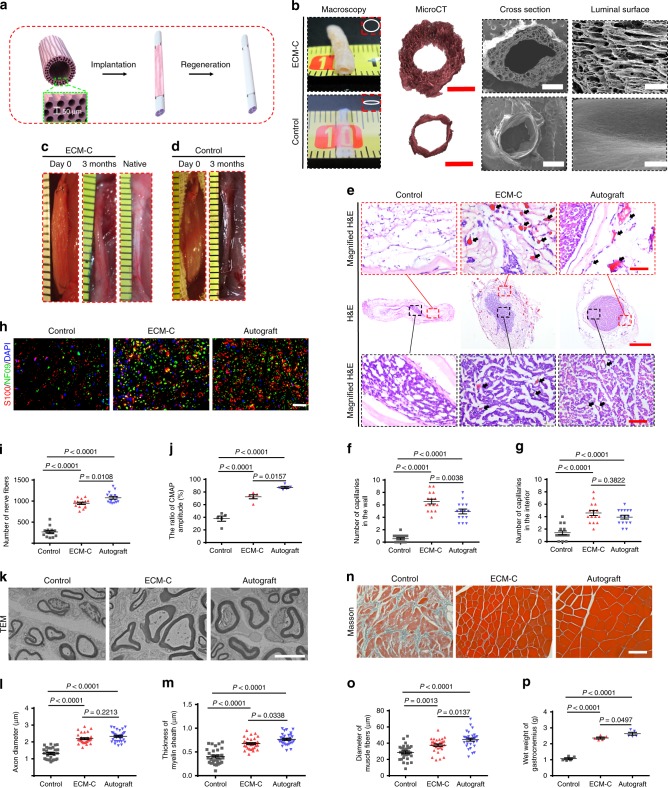
Fig. 6.
Characterisation and utility of tubular scaffolds (ECM-C, control scaffolds and autografts) for nerve regeneration at 3 months. a Schematic illustration of implantation of tubular nerve ECM-C scaffolds for nerve regeneration of the rat sciatic nerve defects. b Macroscopic appearances and microstructures (MicroCT and SEM) of tubular scaffolds. Insets indicate the shape of obtained scaffolds. c, d Macroscopic view of the implanted (day 0) and regenerated nerves (3 months) by ECM-C and control scaffolds in rat sciatic nerve defects. e H&E staining of the transverse sections of regenerated nerves showing the distribution of regenerated capillaries and myelinated fibres in the scaffolds. Black arrows indicate the capillaries. Black and red boxed images are the magnified region of interior and wall of the explanted scaffolds. f, g Semi-quantification of capillaries in the interior and the wall of various scaffolds. h Immunofluorescence staining of the transverse sections of the explanted scaffolds confirmed that the myelinated fibres were positive for NF09 (green) and S100b (red). i, j The number of myelinated fibres and the CMAPs amplitude among various scaffolds (n = 5 animals per group). k Transmission electron micrographs of the transverse sections from various groups. l, m Comparison of the thickness of regenerated myelin sheath and diameter of regenerated myelinated fibres (n = 5 animals per group). n Masson trichrome staining of the cross-sections showing the morphology of gastrocnemius muscle. o, p Average diameter of muscle fibres and wet weight of gastrocnemius muscle (n = 5 animals per group). Bar heights and error bars represent means ± s.e.m. (ANOVA). Statistical analysis (ns = no significance). Scale bar: b–d macroscopic images, 1 mm; microCT images, 500 μm; SEM of cross section, 500 μm; SEM of luminal surface, 100 μm; e H&E, 200 μm; Magnified H&E, 50 μm; h 100 μm; k 5 μm; n 50 μm

