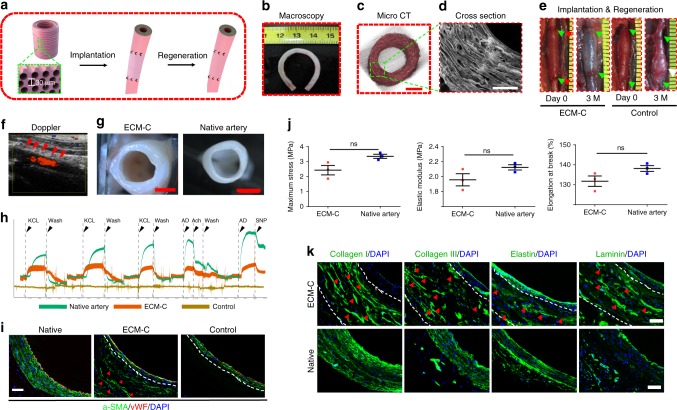
Fig. 7.
Characterisation and utility of tubular scaffolds with circumferentially aligned microchannels in vascular regeneration at 3 months. a Schematic illustration of implantation of the tubular vascular ECM-C scaffolds for artery regeneration of the rat abdominal artery defects. b No kinking formed when the tubular ECM-C scaffolds were folded at 180°. c, d Micro CT and SEM images showing the macroscopic and microscopic appearance of tubular ECM-C scaffolds with circumferentially aligned microchannels observed from the cross section. e The ECM-C vascular scaffolds can withstand the blood pressure after implantation and maintains for 3 months, and remodel into neo-artery, integrating with the host artery. The control scaffolds formed aneurysm at 3 months. The green arrowheads represent the suture line of the anastomosis. The white arrowheads represent the aneurysm formation site. f The patency was evaluated by Laser Doppler ultrasound imaging. The red arrowheads indicate the position of ECM-C guided neoartery. g The cross-sectional morphology of ECM-C guided neoartery was close to native artery under the stereomicroscope. h Examination of the physiological functions of neo-artery revealed obvious sensitivity to vasodilators and vasoconstrictors, which is similar to native artery. The functional signals of control scaffolds were undetectable (n = 3 animals per group). i Immunofluorescence double staining showed the distribution of endothelial cells (vWF, red) and vascular smooth muscle cells (α-SMA, green) in native artery, ECM-C guided neo-artery and control scaffolds. White dashed lines indicate the border of the scaffolds. Red arrowheads indicated the regenerated VSMC along the microchannels. j Comparison of the mechanical properties of neo-artery and native artery including maximum stress, elastic modulus, and elongation at break (from left to right) (n = 3 animals per group). k Immunofluorescence staining showing the distribution of collagen I and III, elastin and laminin in ECM-C guided neoartery and native artery. White dashed lines indicate the border of the ECM-C scaffolds. Red arrowheads represent the deposited ECM components within the microchannels. Bar heights and error bars represent means ± s.e.m. (t-test). Statistical analysis (ns = no significance). Scale bar: c, 500 μm; d, 200 μm; g, 1 mm; i, k, 50 μm

