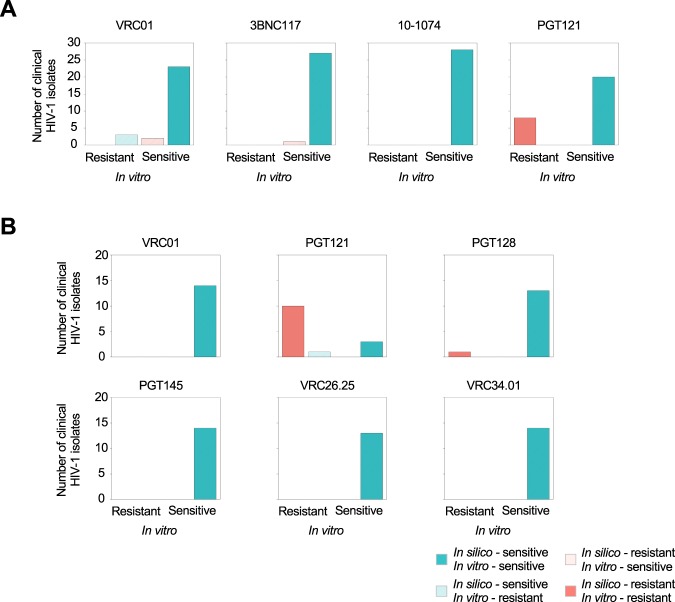
Figure 6.
bNAb-ReP prediction performance on clinical HIV-1 isolates from Bar et al. and Ssemwanga et al. studies. (A) Bar plots highlighting the number of clinical HIV-1 isolates, introduced in the Bar et al. study, separated according to their in silico predictions. Resistant in silico predictions for bNAbs VRC01, 3BNC117, 10–1074, and PGT121 are shown in red and sensitive in cyan, with darker colors representing accurate predictions and light colors inaccurate ones, respectively. (B) Bar plots depicting the number of isolates, introduced by Ssemwanga et al., with resistant in silico predictions shown in red and sensitive in cyan.

