Fig. 3.
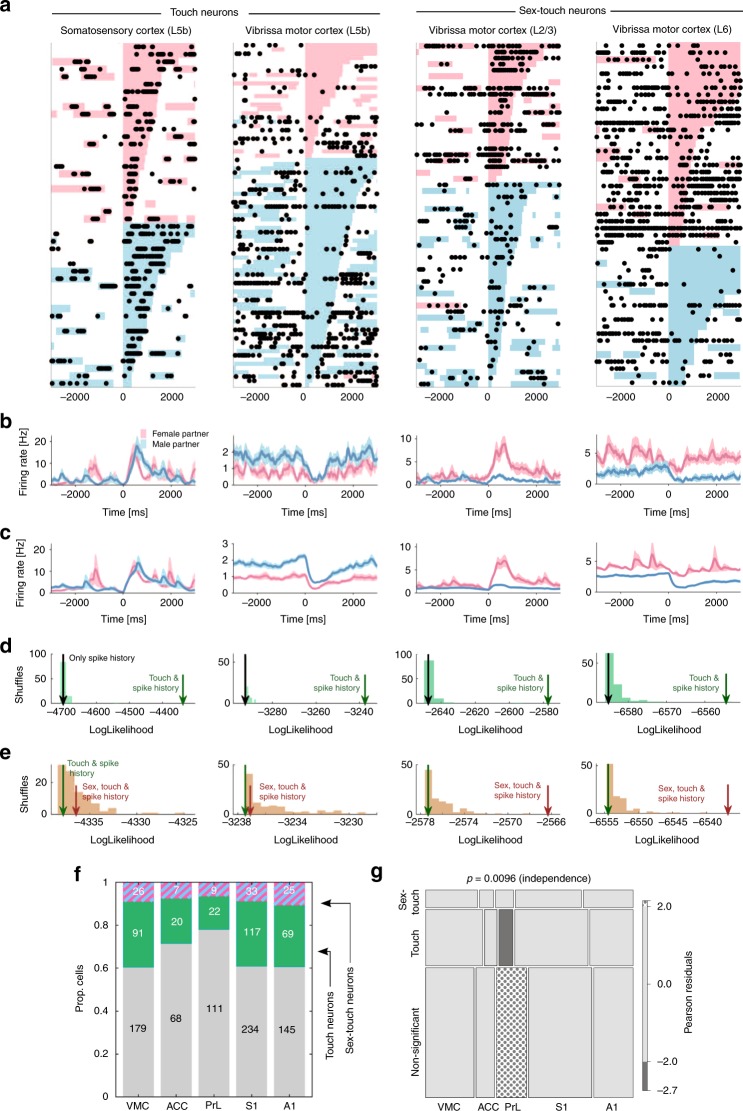
Single cortical neurons signal social touch and partner sex. a Raster plot of example touch (activated S1 L5b neuron and suppressed VMC L5b neuron) and sex-touch neurons (activated VMC L2/3 neuron and suppressed VMC L6 neuron). Raster plots show spike times (black dots) aligned to the first whisker-to-whisker touch in each social-touch episode. Social-touch episodes are sorted by partner sex (female: pink, male: blue) and by duration (indicated by length of colored bar). Many touch episodes happen close together in time, and there is a large variability in the touch duration. b Peri-stimulus time histograms of the example neurons shown in a, separated by partner sex. Line indicates mean firing rate (smoothing: Alpha kernel, τ = 75 ms), shaded area indicates s.e.m, and pink/blue color indicates female/male partners. c Peri-stimulus time histograms of the example neurons shown in (a), calculated from the fitted regression model, shown for comparison (plot conventions as in (b)). d Estimating touch modulation: log-likelihood values of models fitted to the neurons shown in (a). The log likelihood of models depending on touch is indicated by the green arrow, the log likelihood of models without touch is indicated by the gray arrow, and the log-likelihood distribution of shuffled touch models is indicated by green bars. All neurons are significant at p < 0.05 (the green arrow is outside the shuffled distribution). e Log-likelihood values of models fitted to the neurons in (a). The log likelihood of models depending on both partner sex and touch is indicated by the brown arrow, the log likelihood of models without sex is indicated by the green arrow, and the log-likelihood distribution of shuffled sex-touch models is indicated by brown bars. The two touch neurons are not significantly modulated by sex (the brown arrows are inside the shuffled distribution); both sex-touch neurons are significant at p < 0.05. f Number of neurons that are modulated by touch (‘touch neurons’, green color) and neurons that are modulated by touch, but respond differently to male and female conspecifics (‘sex-touch neurons’, pink/blue striped color). g Mosaic plot of the distribution of touch neurons, sex-touch neurons, and nonsignificant neurons across cortical areas (the p value indicates χ2 test of independence). Colors indicate significantly increased (dotted) and decreased (gray) proportions (standardized Pearson residuals at p < 0.05)

