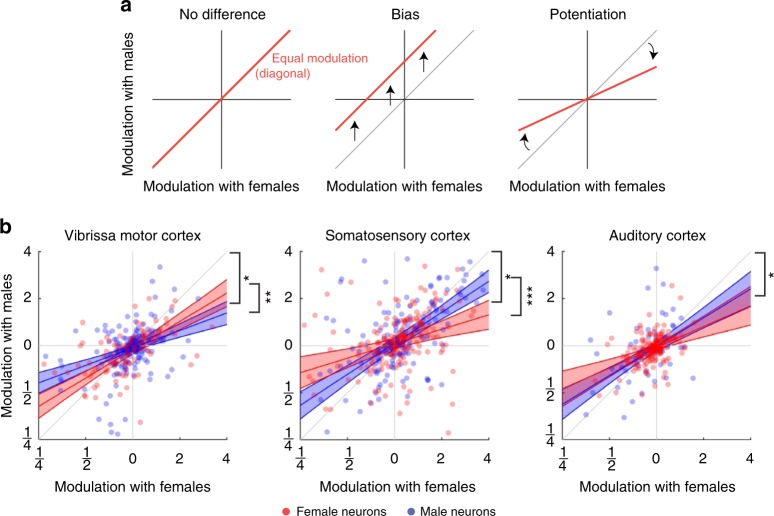
Fig. 5.
Population dynamics depend on both subject sex and partner sex. a Some possible types of population structure. If there is no overall difference between responses to male and female conspecifics, neurons will fall on the diagonal (left panel). A biased response to one partner sex corresponds to a shift away from the diagonal. For example, the red line corresponds to a situation where neurons always fire more spikes when touching males than females (middle panel). A potentiated response to one partner sex corresponds to a change in slope of the regression line. For example, the red line corresponds to a situation where neuronal responses to female conspecifics are always larger in magnitude than responses to male conspecifics (right panel). b Population response pattern depends on subject sex and partner sex. Dots indicate neurons recorded in female (red) and male (blue) subject animals, lines indicate maximum-likelihood fit of modeling the modulation with males as a function of modulation with females and the sex of the subject animal (red = female subject, blue = male subject, shaded area indicates 95% CI) asterisks (*) indicates slope different from unity (outside 95% CI for both males and females), asterisks (**) indicates p < 0.01, asterisks (***) indicates p < 0.001 (full model specification in Supplementary Note 2)

