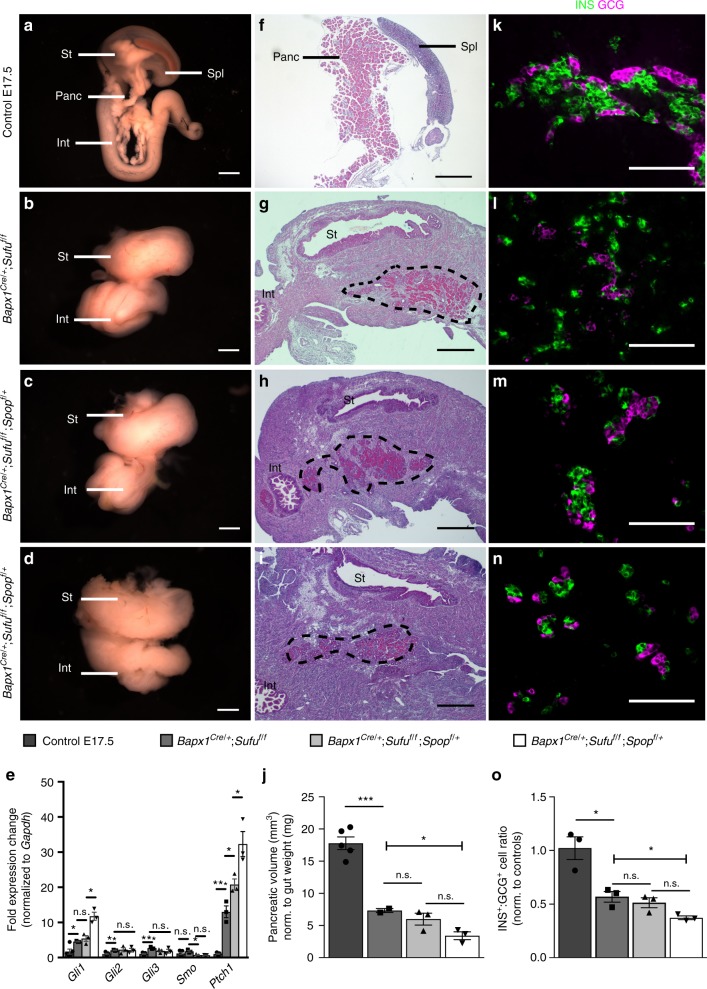
Fig. 2.
Loss of mesenchymal Sufu and Spop impairs pancreatic growth and differentiation. a E17.5 control embryonic gut displaying stomach (St), spleen (Spl), pancreas (Panc), and proximal intestine (Int). b Mesenchymal Sufu knockout (Bapx1Cre/+;Sufuf/f) exhibiting loss of external pancreas. c Heterozygous loss of Spop in Sufu knockout background (Bapx1Cre/+;Sufuf/f;Spopf/+). d Mesenchymal loss of both Sufu and Spop (Bapx1Cre/+;Sufuf/f;Spopf/f) leads to severe morphological dysregulation. e qPCR gene expression analysis for Hedgehog pathway members and targets in pancreatic mesenchyme upon Sufu and Spop deletion (n = 3 samples per genotype). f–i Histological images distinguishing highly cytoplasmic pancreatic tissue (pink eosin staining) in E17.5 control (f), Bapx1Cre/+;Sufuf/f (g), Bapx1Cre/+;Sufuf/f;Spopf/+ (h), and Bapx1Cre/+;Sufuf/f;Spopf/f (i) embryos (dashed line outlines pancreas). j Quantification of pancreatic volume (mm3) normalized to gut weight (mg) in Sufu and Spop mesenchymal mutants (n = 5 control samples, n = 3 samples per mutant genotype). k–n Immunostaining for INS and GCG in E17.5 control (k), Bapx1Cre/+;Sufuf/f (l), Bapx1Cre/+;Sufuf/f;Spopf/+ (m), and Bapx1Cre/+;Sufuf/f;Spopf/f (n) pancreata. o Assessment of INS+ to GCG+ cell number ratios in Sufu and Spop compound mutants, normalized to controls (n = 3 samples per genotype). Data are means ± SEM. n.s. denotes not significant, * denotes p < 0.05, ** denotes p < 0.005, *** denotes p < 0.0005 by Student’s un-paired, two tailed t-test. Scale bars: Whole mount; 1 mm, Histology; 500 µm, Immunofluorescence; 100 µm

