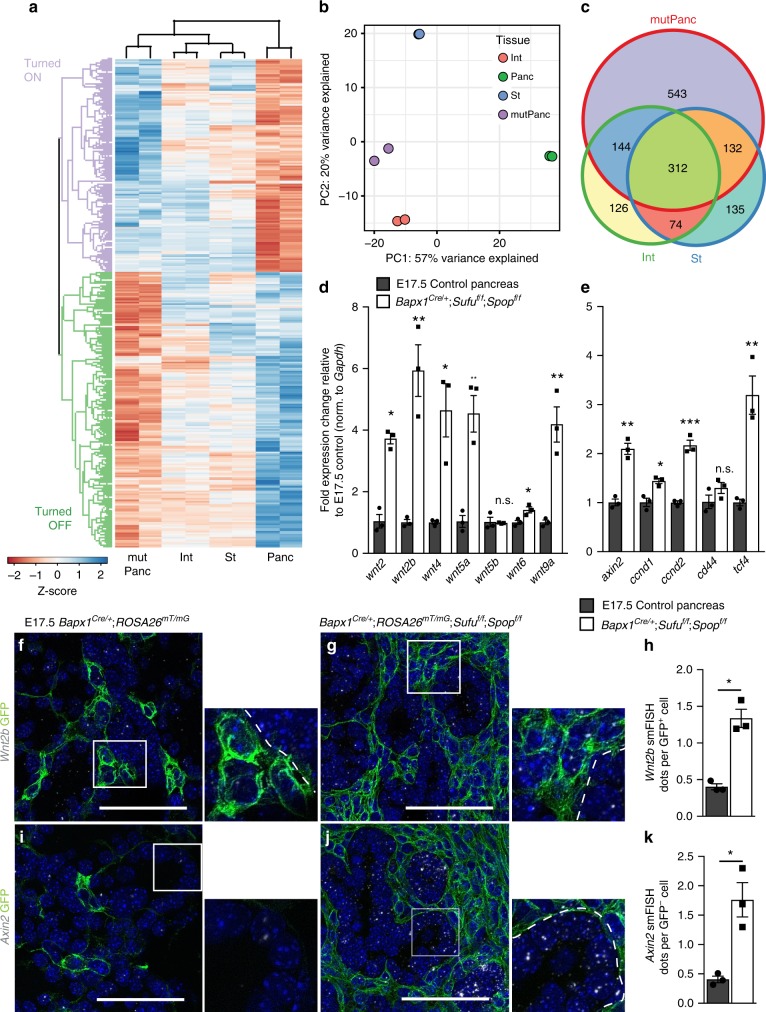
Fig. 5.
Sufu Spop mesKO pancreatic mesenchyme shifts towards a gastrointestinal-like signature. a Unsupervised hierarchical clustering analysis of all significantly differentially expressed genes in E13.5 Bapx1Cre/+;ROSA26mT/mG;Sufuf/f;Spopf/f mutant pancreatic mesenchyme (mutPanc) and control pancreatic (Panc), stomach (St), and intestinal (Int) mesenchyme. Plot is scaled by the Z-score of log-scaled DESeq2 normalized counts, with increasing values (from red to blue) indicating relative enrichment. b Principal component analysis demonstrating that the mutant pancreatic mesenchyme clusters significantly closer to stomach and intestinal mesenchyme as opposed to control pancreatic mesenchyme. c Venn diagram representing common and unique significantly differentially regulated genes between Bapx1Cre/+;ROSA26mT/mG;Sufuf/f;Spopf/f pancreatic mesenchyme vs. control stomach and intestinal mesenchyme. d, e qPCR analysis of Wnt ligand (d) and Wnt target gene (e) expression in E17.5 Bapx1Cre/+;ROSA26mT/mG; Sufuf/f;Spopf/f vs. control whole pancreata (n = 3 samples each genotype). f, g Single molecule fluorescent in situ hybridization (smFISH) for Wnt ligand, Wnt2b, in E17.5 control (f) vs. Bapx1Cre/+;ROSA26mT/mG;Sufuf/f;Spopf/f (g) pancreata co-stained with GFP to mark Bapx1-expressing mesenchyme. h Quantification of average Wnt2b smFISH transcripts per GFP+ mesenchymal cell in E17.5 mutants vs. controls (n = 3 samples each genotype). i, j smFISH for Wnt target gene, Axin2, in E17.5 control (i) vs. Bapx1Cre/+;ROSA26mT/mG;Sufuf/f;Spopf/f (j) pancreata co-stained with GFP to mark Bapx1-expressing mesenchyme. k Quantification of average Axin2 smFISH transcripts per GFP- epithelial cell in E17.5 mutants vs. controls (n = 3 samples each genotype). White boxes correspond to zoomed-in inserts. Dashed outline denotes border between epithelium and mesenchyme. Data are means ± SEM. n.s. denotes not significant, * denotes p < 0.05, **denotes p < 0.005, *** denotes p < 0.005 by Student’s un-paired, two tailed t-test. Scale bars: 100 µm

