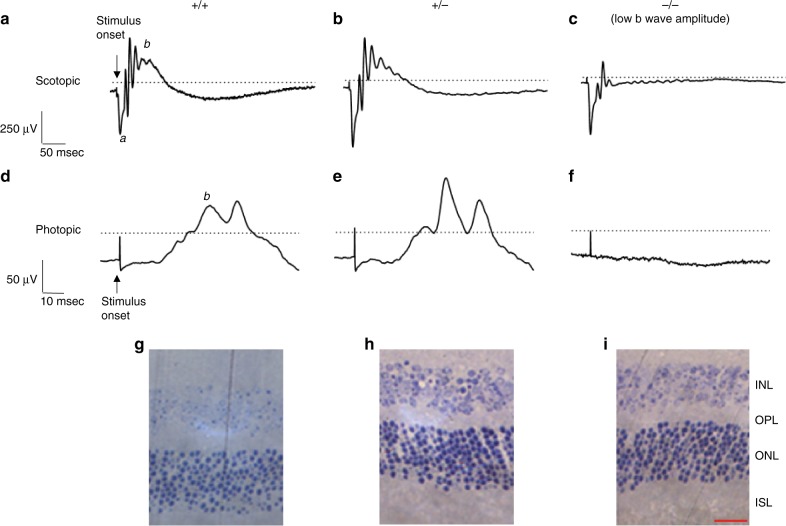
Fig. 7.
Analysis of ophthalmological defects in Snap29−/− mice. Representative scotopic (a–c; amplitude (in microvolt) and time (in millisecond) calibrations at the left of tracing a) and photopic (d–f; amplitude (in microvolt) and time (in millisecond) calibrations at the left of tracing d) ERG wave forms. a Scotopic ERG recorded from wild-type mouse; b Scotopic ERG recorded from heterozygous mouse; c Scotopic ERG recorded from homozygous mouse with low b wave amplitude; d photopic ERG recorded from wild-type mouse; e photopic ERG recorded from heterozygous mouse; f photopic ERG recorded from homozygous mouse with low b wave amplitude. In tracings a and d, the ERG a- and b-waves are identified with letters a and b, respectively. Representative eye histology of wild-type male mouse (g) at P118; heterozygous female at P83 (h) and homozygous female mouse at P87(i). ISL inner segment layer, ONL outer nuclear layer, OPL outer plexiform layer, INL inner nuclear layer. Scale bar represents 25 µm

