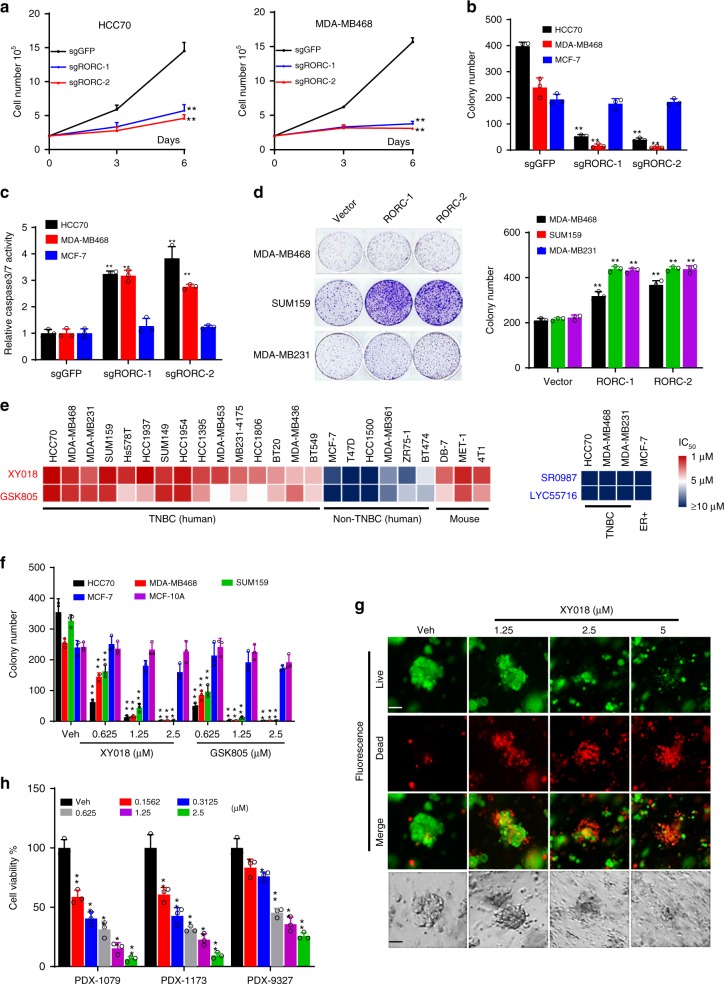
Fig. 2.
RORγ is a major driver of TNBC cell survival. a TNBC cells were infected with lentiviruses expressing control sgRNA against GFP or two different sgRNAs against RORC and Cas9. Three and six days later, viable cell numbers were counted. b TNBC cells were infected as in (a). Fourteen days later, colonies were counted. c Caspase 3/7 activities were measured by using a luminescent caspase-Glo 3/7 assay kit with TNBC cells harvested 3 days after the infections as in (a). d TNBC cells were infected by RORγ overexpression or control lentivirus. Fourteen days later, representative images of colony formation were taken (left) and colonies were counted (right). e Heat map presentation of IC50 for RORγ antagonists GSK805 and XY018, or agonists SR0987 and LYC55716 in indicated cell lines treated for 4 days. Cell viability was measured with CellTiter Glo on GLOMAX microplate luminometer. f Indicated cells were treated with vehicle (DMSO) or different concentrations of XY018 and GSK805 for 14 days, after which colonies was counted. g, h PDX-derived organoids were treated with DMSO or indicated concentrations of XY018. g Six days later, representative images were taken under a fluorescence microscope (top three rows) or standard light microscope (bottom row). Scale bar represents 20 µM. h Four days later, cell viability in organoids was measured with CellTiter-Glo. Data are shown as mean ± s.d. n = 3. Student’s t test. **p < 0.01

