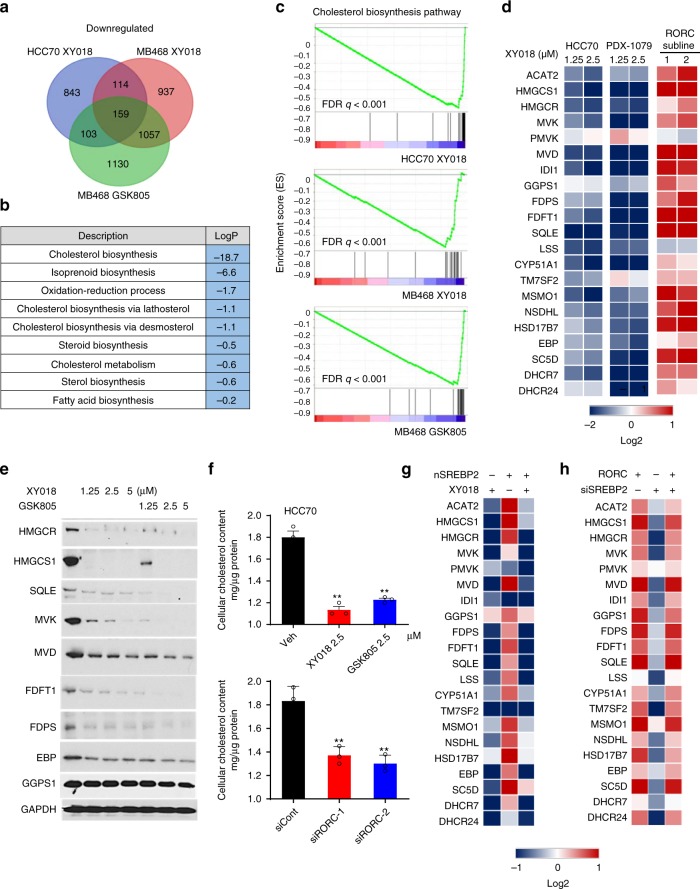
Fig. 3.
RORγ is a master activator of cholesterol biosynthesis in TNBC. a Venn diagram of the number of genes with expression significantly (1.5-fold) downregulated, which is detected by RNA-seq of HCC70 and MDA-MB468 cells treated for 24 h with 2.5 μM XY018 or GSK805. b Gene ontology analysis of the 159 genes with expression downregulated in both HCC70 and MB468 cells by XY018 and GSK805 treatment as shown in (a). Hypergeometric test and Benjamini–Hochberg p-value correction. c GSEA plots depicting the enrichment of genes downregulated (1.5-fold) in cholesterol-biosynthesis pathway in HCC70 cells treated with XY018 (top), or in MDA-MB468 cells treated with XY018 (middle) or GSK805 (bottom). FDR false-discovery rate. d Heat maps of mRNA expression changes of 21 cholesterol-biosynthesis genes in TNBC cells. Left, mRNA expression of HCC70 treated with XY018 for 24 h was analyzed by RNA-seq. Middle, mRNA expression of organoids derived from PDX-1079 treated with XY018 for 24 h was analyzed by qRT-PCR. Right, mRNA expression of MDA-MB468 cells treated with vector control or overexpressed RORC was analyzed by qRT-PCR. n = 3. The experiments were repeated three times. e Immunoblotting of proteins involved in cholesterol-biosynthesis pathway in MDA-MB468 cells treated with XY018 or GSK805 for 3 days. The experiments were repeated three times. f Total cellular cholesterol contents in HCC70 cells treated with indicated RORγ antagonists (top) or transfected with siRORC (bottom) for 3 days were analyzed after organic extraction and normalization to protein concentrations. n = 3, data are shown as mean ± s.d. Student’s t test. ∗∗p < 0.01. g Heat map display of fold changes (in log2) of cholesterol-biosynthesis pathway gene mRNA analyzed by qRT-PCR in HCC70 cells transfected with nSREBP2 or control vector for 24 h and then treated with XY018 (2.5 µM) or vehicle (DMSO) for another 24 h. n = 3. The experiments were repeated three times. h Heat map display of fold changes (in log2) of cholesterol-biosynthesis pathway gene mRNA analyzed by qRT-PCR in RORC-overexpressed MDA-MB468 cells transfected with siSREBP2 or control siRNA for 24 h, n = 3. The experiments were repeated three times. Source data are provided in a Source Data file

