Fig. 5.
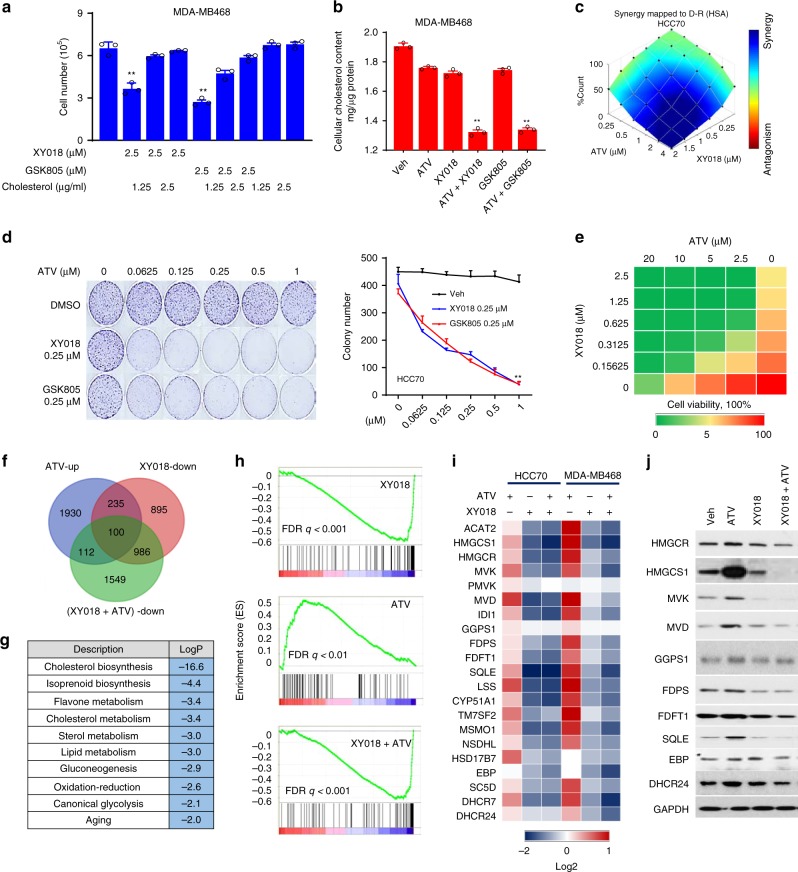
RORγ inhibitors strongly synergize with statins in killing TNBC cells. a Exogenous cholesterol supply for 24 h rescued MDA-MB468 cell death caused by treatment with RORγ antagonists for 24 h. n = 3. b Total cellular cholesterol contents in MDA-MB468 cells treated with indicated RORγ antagonists (1.25 µM) or atorvastatin (ATV, 1.25 µM) for 2 days were analyzed after organic extraction. n = 3. c HCC70 cells were treated with XY018 and ATV as indicated for 2 days. Cell numbers were counted. Blue indicates synergy while red indicates antagonism between drugs. n = 3, the experiments were repeated three times. d HCC70 cells were treated with indicated concentrations of XY018 or GSK805 alone, or in combination with ATV for 2 weeks. Representative images of colony formation were taken (left), and colonies were counted (right). n = 3. e Organoids derived from PDX-1079 were treated with XY018 and ATV as indicated for 3 days. The cell viability was measured with CellTiter-Glo. n = 3. The experiments were repeated three times. f Venn diagram of the number of genes significantly downregulated by XY018 (1.25 μM), or upregulated by ATV (1.25 μM) or downregulated by XY018 + ATV in HCC70 cells treated for 24 h, which were detected by RNA-seq. g Gene ontology analysis of the 100 genes overlapped in expression alterations as shown in (f) in response to indicated compound treatment. Hypergeometric test and Benjamini–Hochberg p-value correction. h GSEA plots depicting the enrichment of genes downregulated (1.5-fold) in cholesterol-biosynthesis pathway in HCC70 cells treated with XY018 (up) or ATV (middle) or both XY018 and ATV (bottom). FDR false-discovery rate. i Heat maps of mRNA expression changes of cholesterol-biosynthesis genes in cells treated as indicated for 24 h and analyzed by RNA-seq. j Immunoblotting of proteins involved in cholesterol-biosynthesis pathway in MDA-MB468 cells treated with vehicle, 2.5 µM XY018, 1.25 µM ATV, or both XY018 and ATV for 3 days. The experiments were repeated three times. Data are shown as mean ± s.d. Student’s t test. ∗∗p < 0.01. Source data are provided in a Source Data file

