Fig. 3.
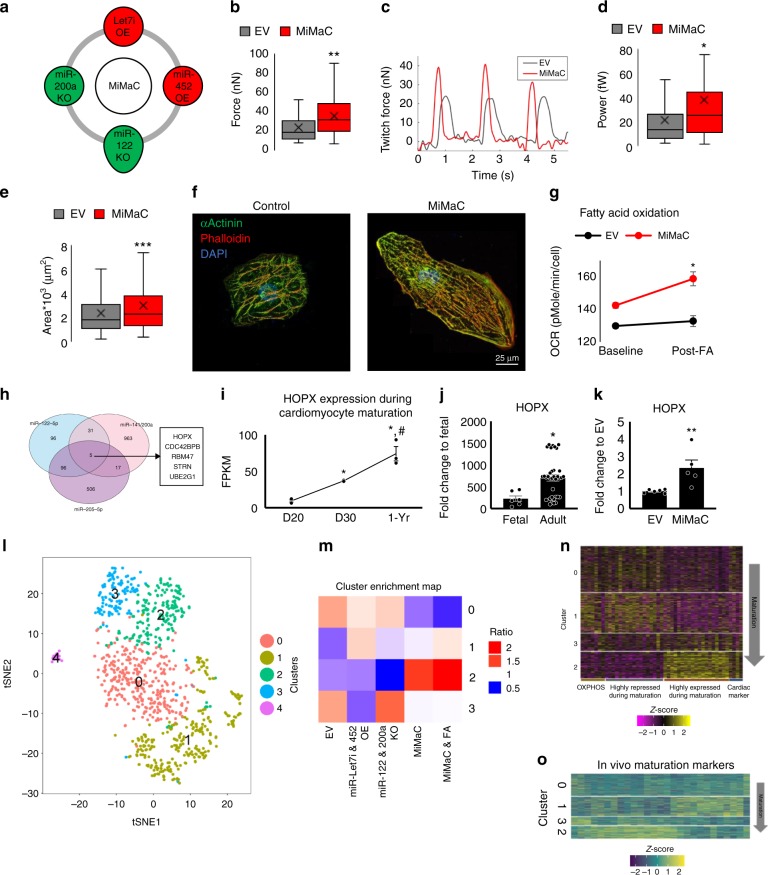
MiMaC accelerates hiPSC-CM maturation. a Schematic of the four microRNAs combined to generate MiMaC. b Single cell force of contraction assay on micro-posts showed that MiMaC treated hiPSC-CMs led to a significant increase in twitch force. EV: 24nN, MiMaC: 36nN. **p < 0.01, t-test followed by a Mann-Whitney rank sum test. n = 40–54 cells measured. c Representative trace of an EV (control) and a MiMaC treated hiPSC-CM. d Single cell force of contraction assay on micro-posts showed that MiMaC treated hiPSC-CMs led to a significant increase in power. EV: 22fW, MiMaC: 38fW. *p < 0.05, t-test followed by a Mann-Whitney rank sum test. n = 40–54 cells measured. e Cell size analysis showed that MiMaC treated hiPSC-CMs led to a significant increase in area. EV: 2389 μm2, MiMaC: 3022 μm2. ***p < 0.001, t-test followed by a Mann-Whitney rank sum test. n = 220–298 cells measured. f Representative confocal microscopy images of EV and MiMaC treated hiPSC-CMs. αActinin (green), phalloidin (red) and DAPI are shown. g Seahorse analysis of fatty acid oxidation capacity showed that MiMaC treated hiPSC-CMs matured to a point where they could oxidize palmitate for ATP generation while controls cells were not able to utilize palmitate. MiMaC hiPSC-CMs had a significant increase in OCR due to palmitate addition. *p < 0.05, t-test was performed. n = 8–9 biological replicates. Error bars are standard error. h Venn diagram of KO microRNA predicted targets and the identification of HOPX as a common predicted targeted between all KO miRs screened for cardiomyocyte maturation. i Plot of HOPX expression from RNA-Sequence data during cardiomyocyte maturation. HOPX expression is significantly higher in D30 and 1-year hESC-CMs and 1-year hESC-CMs have significantly higher HOPX as compared to D30 hESC-CMs. * denotes significance vs D20. # denotes significance vs D30. **p < 0.01 and *p < 0.05 are vs D20, #p < 0.05 is vs D30, one-way ANOVA was performed. n = 2–4 biological replicates. Error bars are standard error. j HOPX expression in adult human ventricle tissue is significantly higher than fetal human ventricular tissue. Plotted using RNA-sequencing data. *p < 0.05, a negative binomial test was used, n = 6 for fetal samples, n = 35 for adult samples. k RT-qPCR of HOPX expression showed that MiMaC treated hiPSC-CMs at D30 had a statistically significant higher level of HOPX as compared to EV control D30 hiPSC-CMs. **p < 0.01, t-test followed by a Mann-Whitney rank sum test. n = 5–6 biological replicates. l Single cell RNA-Seq tSNE plot of unbiased clustering of microRNA treated hPSC-CMs. m Cluster plot detailing which treatment groups are enriched in each cluster. n Heatmap of maturation categories based on MiMaC cluster. o Heatmap of in vivo human maturation markers that are upregulated with maturation (yellow). Box plot middle line represents the median, x represents mean, bottom line of the box represents the median of the bottom half (1st quartile) and the top line of the box represents the median of the top half (3rd quartile). The whiskers extend from the ends of the box to the non-outlier minimum and maximum value. Bar graphs show mean with standard error. Source data are provided as a Source Data file

