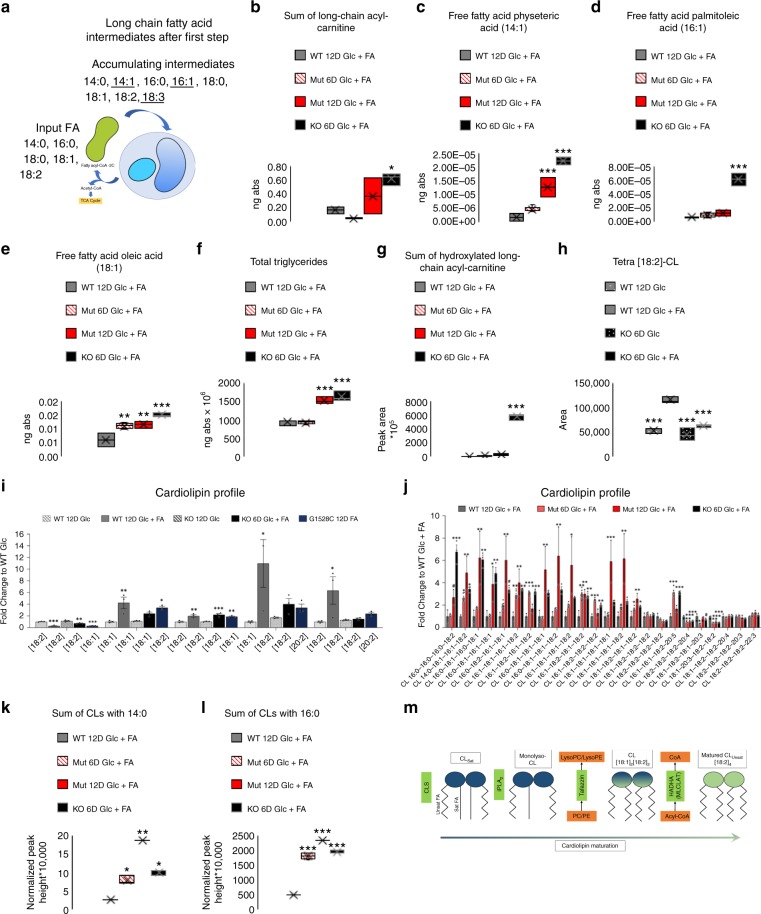
Fig. 7.
Fatty acid challenged HADHA KO and Mut CMs have elevated fatty acids and abnormal cardiolipin profiles. a Model of long-chain FA intermediate accumulation after the first step of long-chain FAO due to the loss of HADHA. b The sum of all long-chain acyl-carnitines in WT, Mut and KO FA treated hPSC-CMs. *p < 0.05, one-way ANOVA was performed vs WT 12D Glc + FA. n = 2–6 biological replicates. c Amount of physeteric acid in the free fatty acid state in WT, Mut and KO FA treated hPSC-CMs. ***p < 0.001, one-way ANOVA was performed vs WT 12D Glc + FA. n = 2–6 biological replicates. d Amount of palmitoleic acid in the free fatty acid state in WT, Mut and KO FA treated hPSC-CMs. ***p < 0.001, one-way ANOVA was performed vs WT 12D Glc + FA. n = 2–6 biological replicates. e Amount of oleic acid in the free fatty acid state in WT, Mut and KO Glc + FA treated hPSC-CMs. **p < 0.01, ***p < 0.001, one-way ANOVA was performed vs WT 12D Glc + FA. n = 2–6 biological replicates. f The sum of all triglycerides in WT, Mut and KO FA treated hPSC-CMs. ***p < 0.001, one-way ANOVA was performed vs WT 12D Glc + FA. n = 2–6 biological replicates. g The sum of all hydroxylated long-chain acyl-carnitine species found in WT, Mut and KO Glc + FA treated hPSC-CMs. ***p < 0.001, one-way ANOVA was performed vs WT 12D Glc + FA. n = 2–6 biological replicates. h Relative amount of tetra[18:2]-CL in WT and HADHA KO CMs treated with either Glc or Glc + FA. ***p < 0.001, one-way ANOVA was performed vs WT 12D Glc + FA. n = 3 biological replicates. i Cardiolipin profile generated from targeted lipidomics for WT, HADHA KO and HADHA c.1528G > C CMs treated with either Glc or Glc + FA. *p < 0.05, **p < 0.01, ***p < 0.001, one-way ANOVA was performed vs WT 12D Glc. n = 3 biological replicates. j Cardiolipin profile generated from global lipidomics for WT CMs 12D Glc + FA, HADHA Muts CM 6D and 12D Glc + FA and HADHA KO CMs 12D Glc + FA. *p < 0.05, **p < 0.01, ***p < 0.001, one-way ANOVA was performed vs WT 12D Glc + FA. n = 2–6 biological replicates. k The sum of all CLs that have myristic acid (14:0) in their side chain in WT, HADHA Mut and HADHA KO CM FA treated hPSC-CMs. **p < 0.01, ***p < 0.001, one-way ANOVA was performed vs WT 12D Glc + FA. n = 2–6 biological replicates. l The sum of all CLs that have palmitic acid (16:0) in their side chain in WT, HADHA Mut and HADHA KO CM FA treated hPSC-CMs. ***p < 0.001, one-way ANOVA was performed vs WT 12D Glc + FA. n = 2–6 biological replicates. m Schematic diagram of how HADHA works in series with TAZ to remodel CL. Box plot middle line represents the median, x represents mean, bottom line of the box represents the median of the bottom half (1st quartile) and the top line of the box represents the median of the top half (3rd quartile). The whiskers extend from the ends of the box to the non-outlier minimum and maximum value. Bar graphs show mean with standard error. Source data are provided as a Source Data file

