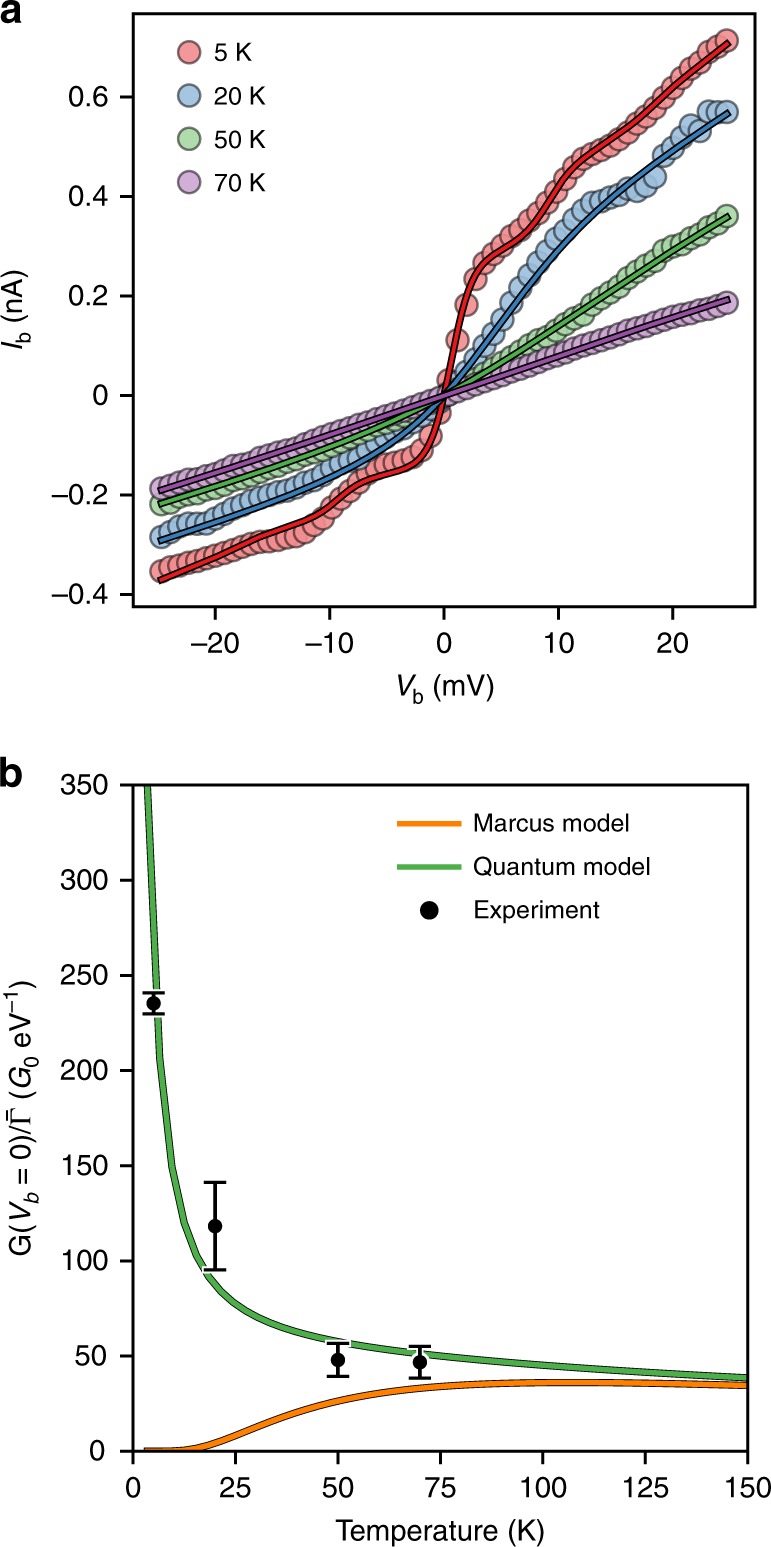
Fig. 3.

Temperature-dependent charge-transport in device A. a IV traces of device A at various temperatures (circles) and the global fit (solid lines) where all parameters except the molecule-electrode couplings are shared. b Zero-bias conductance normalised by () as a function of temperature. Black circles: experimental values with error bars (95% confidence interval) obtained by propagating a random 0.2 pA error on current measurements with the uncertainty on ΓS and ΓD obtained from the fits to the quantum model shown in a. Orange line: Marcus model using λ = 27.6 meV. Green line: Quantum model using one mode and a broad background (ћω = 4.1 meV, S = 0.4, λo = 26 meV, ωc = 8.3 meV)
