Figure 2.
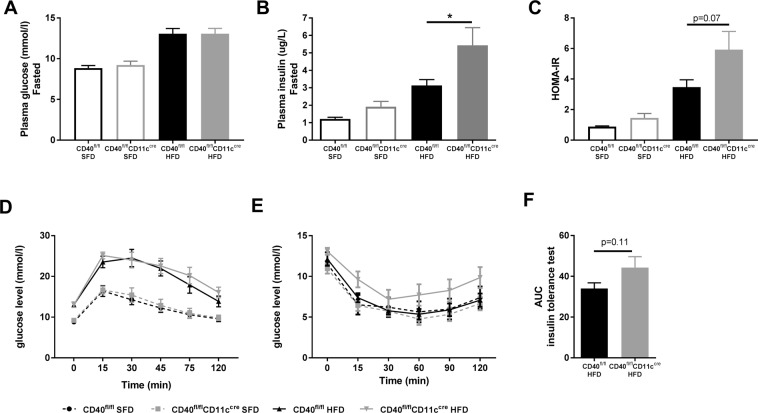
CD40fl/flCD11ccre mice display slightly aggravated insulin resistance. (A) Plasma glucose levels after 6 hours of fasting. (B) Plasma insulin levels after 6 hours of fasting. (C) HOMA-IR. (D) Plasma glucose levels measured during the glucose tolerance test (GTT). (E) Plasma glucose levels measured during the insulin tolerance test (ITT). (F) Area under the curve (AUC) insulin tolerance test. Data is represented as mean ± SEM. *P < 0.05 for comparison between WT and CD40fl/flCD11ccre mice fed the same diet. n = 7/group for SFD, and n = 8/group for HFD.

