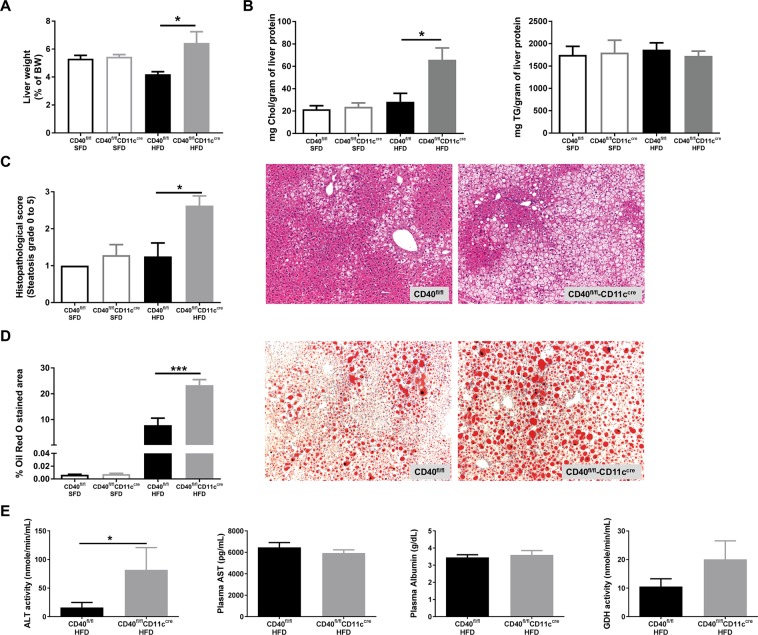
Figure 3.
Increased liver steatosis characterizes CD40fl/flCD11ccre mice after 18 weeks of HFD. (A) Liver weight (grams). (B) Total cholesterol/gram protein and TG/gram protein of liver. (C) Histopathological scoring of liver steatosis and representative H&E staining of liver. (D) Quantification of liver Oil-red-O (ORO) staining and representative pictures. (E) Plasma liver enzymes: alanine aminotransferase (ALT) activity, aspartate aminotransferase (AST) levels, albumin levels and glutamate dehydrogenase (GDH) activity. Data is represented as mean ± SEM. *P < 0.05, **P < 0.01, ***p < 0.001 for comparison between WT and CD40fl/flCD11ccre mice fed the same diet. n = 7/group for SFD, and n = 8/group for HFD.

