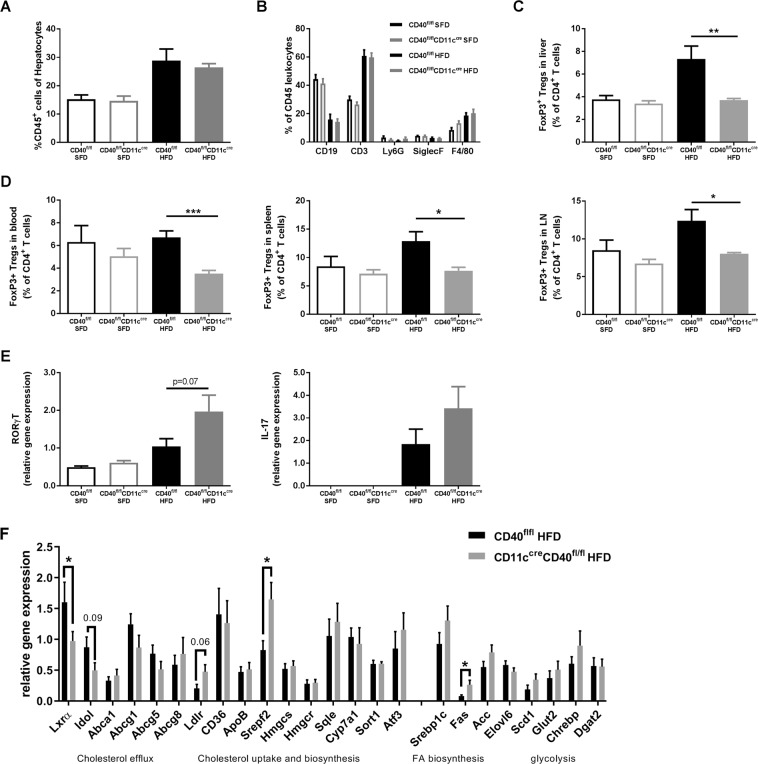
Figure 4.
Reduced numbers of regulatory T cells (Tregs) were found in CD40fl/flCD11ccre mice after 18 weeks of HFD. (A) Histological quantification of CD45 staining of liver. (B) Flow cytometric analysis of leukocyte subsets in the liver. (C) % of CD4+FoxP3+ Tregs in liver. (D) Systemic % of CD4+FoxP3+ Tregs measured in blood, spleen, and lymph nodes (LN). (E) liver mRNA expression of RORγT and IL-17. (F) mRNA expression of cholesterol metabolism genes in the liver of HFD fed CD40fl/flCD11ccre and WT mice. Data is represented as mean ± SEM. *P < 0.05; **P < 0.01, ***p < 0.001 for comparison between WT and CD40fl/flCD11ccre mice fed the same diet. n = 7/group for SFD, and n = 8/group for HFD.

