Figure 6.
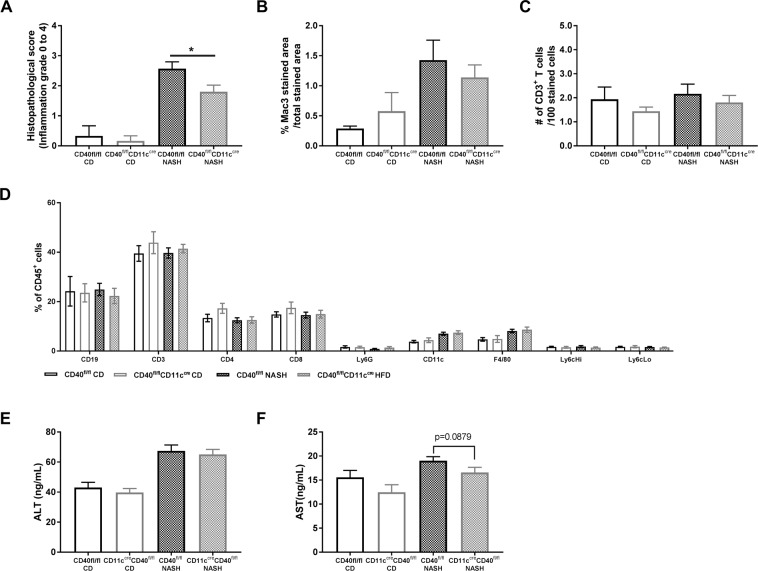
Liver inflammation is lower in CD40fl/flCD11ccre compared to WT mice on a NASH inducing diet. (A) Mean histopathological inflammation grade. (B) quantification of Mac3 staining in the liver (C) quantification of CD3 staining in the liver. (D) Liver leukocyte subsets analyzed by FACS. (E) plasma ALT levels. (F) plasma AST levels. Data is represented as mean ± SEM. *P < 0.05 for comparison between WT and CD40fl/flCD11ccre mice fed a similar diet. n = 6/group for CD, and n = 15/group for NASH diet.

