Fig. 2.
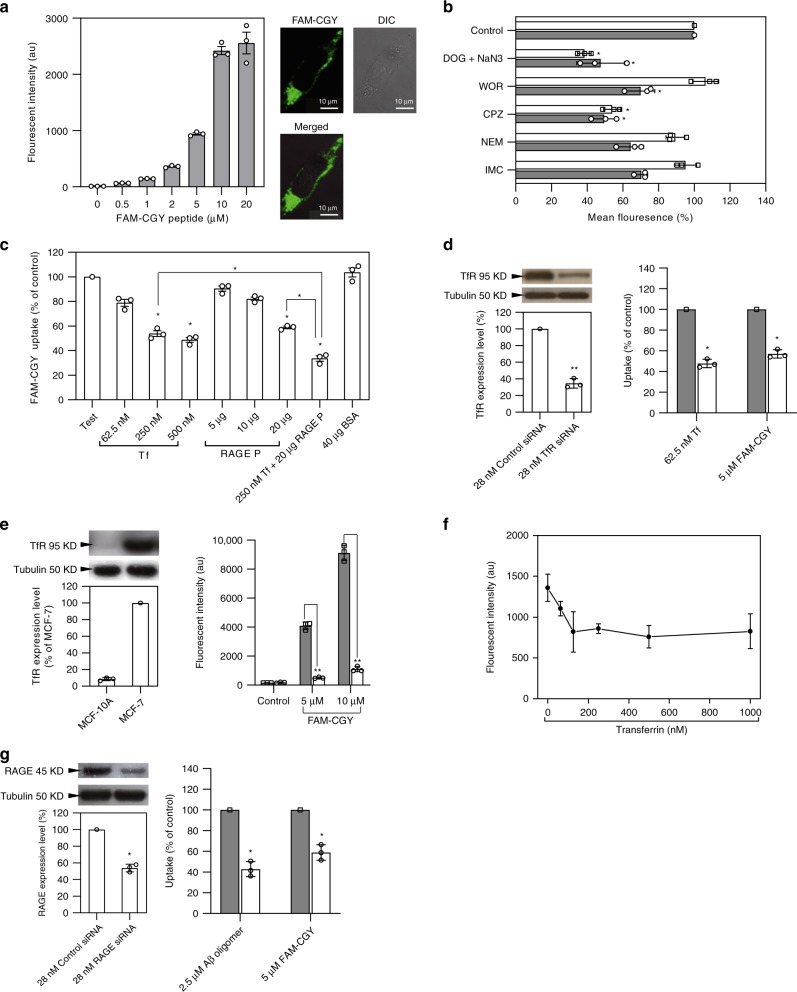
NLC-cell interaction studies. a Concentration-dependent uptake of FAM-CGY assemblies by hCMEC/D3 cells at 24 h, 37 °C. The right panel shows a typical fluorescence microscopy and differential interference contrast (DIC) images of a live hCMEC/D3 cell post FAM-CGY (5 µM) challenge. b The effect of internalisation inhibitors on the uptake of FAM-CGY NLC (final concentration 5 µM) and Texas Red-labelled transferrin (5 µg per well) by hCMEC/D3 cells. The results represent mean fluorescent intensity with respect to Control (no metabolic inhibitor). Open column = transferrin; grey column = FAM-CGY. c FAM-CGY NLC (5 µM) uptake by hCMEC/D3 cells is competitively inhibited by partially iron saturated human transferrin (Tf) and a commercially propriety RAGE peptide (RAGE P). Test column = reference FAM-CGY NLC uptake (no inhibitors) with auto-fluorescence subtracted. Other incubations are compared with Test incubation. Bovine serum albumin (BSA) was used as an irrelevant protein. d Down-regulation of TfR in hCMEC/D3 cells with TfR-specific siRNA reduces Tf and FAM-CGY uptake. In the right panel, open column = control siRNA treated cells and grey column = TfR siRNA treated cells. e Comparison of TfR expression in MCF-7 and MCF-10A cells and FAM-CGY uptake. In the right panel, open column = MCF-7 cell line and grey column = MCF-10A cell line. f Diminished NLC (final concentration 5 μM) binding to MCF-7 cells at 4 °C on saturation of TfR binding sites. au = arbitrary unit. g The effect of RAGE downregulation in hCMEC/D3 with a RAGE-specific siRNA on TAMRA-labelled Aβ oligomer and FAM-CGY uptake. In the right panel, open column = control siRNA treated cells and grey column = RAGE siRNA treated cells. All incubations were done in triplicate and each experiment was repeated three times. Panels represent the mean value of three separate experiments ± s.d. and each dot indicates the mean of three technical replicates. *p < 0.05 and **p < 0.01, non-paired two-sided student t-test compared with respective controls. Source data are available in the Source Data file

