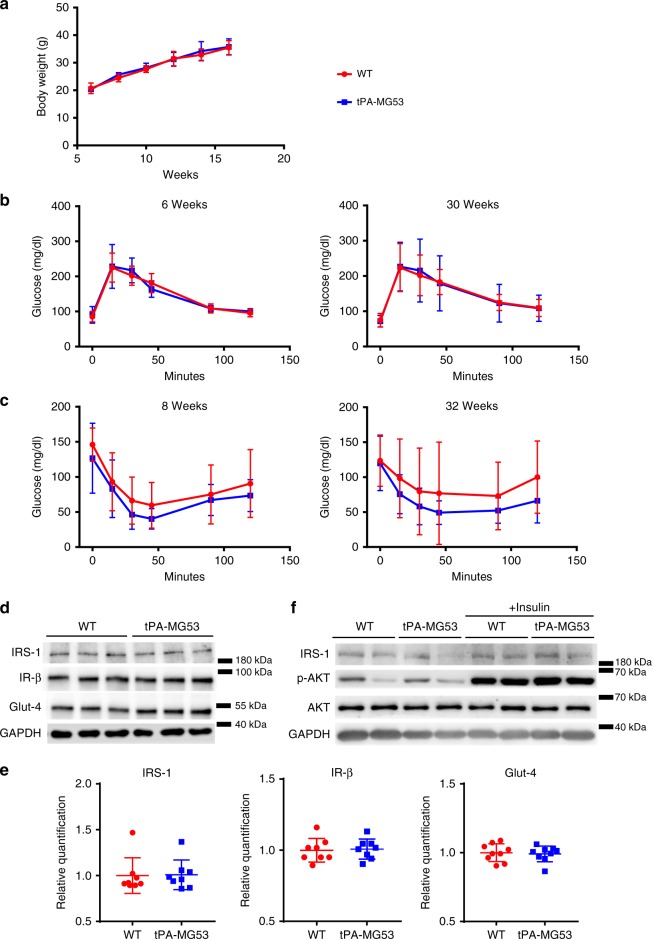
Fig. 2.
Assessment of insulin signaling and glucose handling in tPA-MG53 and WT mice. a tPA-MG53 and WT littermate mice at 6 weeks were treated with HFD and the changes in body weight were followed for 10 weeks (n = 5 per group). b Glucose tolerance tests were conducted with tPA-MG53 and WT littermates at the age of 6 weeks (left) and 30 weeks (right). c Insulin-tolerance tests were conducted with tPA-MG53 and WT littermates at the age of 8 weeks (left) and 32 weeks (right). n = 6 for WT, n = 5 for tPA-MG53. d TA muscle (60 µg total protein per lane) derived tPA-MG53 and WT littermates were probed with antibodies against IRS-1, IR-β, Glut-4. GAPDH serves as loading control. e Quantification of protein expressions based on western blot. f tPA-MG53 and WT mice were treated with insulin (0.75 U/kg) for 15 min, fresh TA muscles were probed with antibodies against IRS-1, p-Akt, Akt, and GAPDH. Error bar represents the standard deviation

