
Fig. 2.
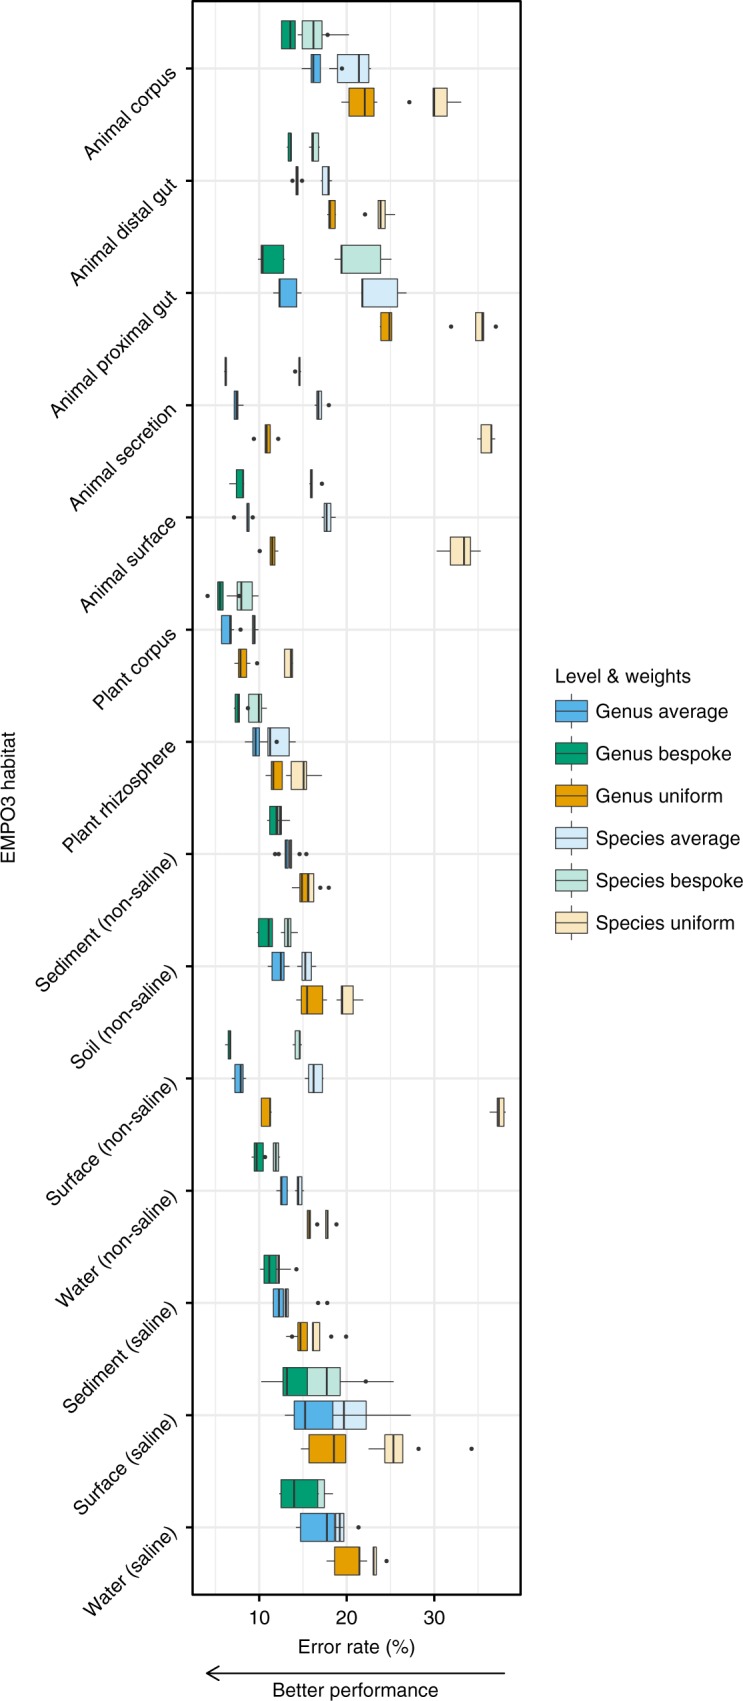
Bespoke weights outperform average weights across EMPO 3 habitat types, and average weights outperform uniform weights (sign test P = 6.1 × 10⁻⁵). Columns show average proportion of incorrectly classified reads for differing taxonomic weighting strategies and at genus and the species levels. Bespoke weights were habitat-specific. Average weights were averaged across the 14 EMPO 3 habitats. Uniform weights are the current best practice. Tests were based on 5-fold cross validation across 18,222 empirical taxonomic abundances. Box plots are across cross-validation folds. Box bounds and centre lines show first and third quartiles and median. Whiskers extend to measurements no further than 1.5 times the interquartile range from the nearest quartiles. Outliers are plotted individually. Source data are provided as a Source Data file