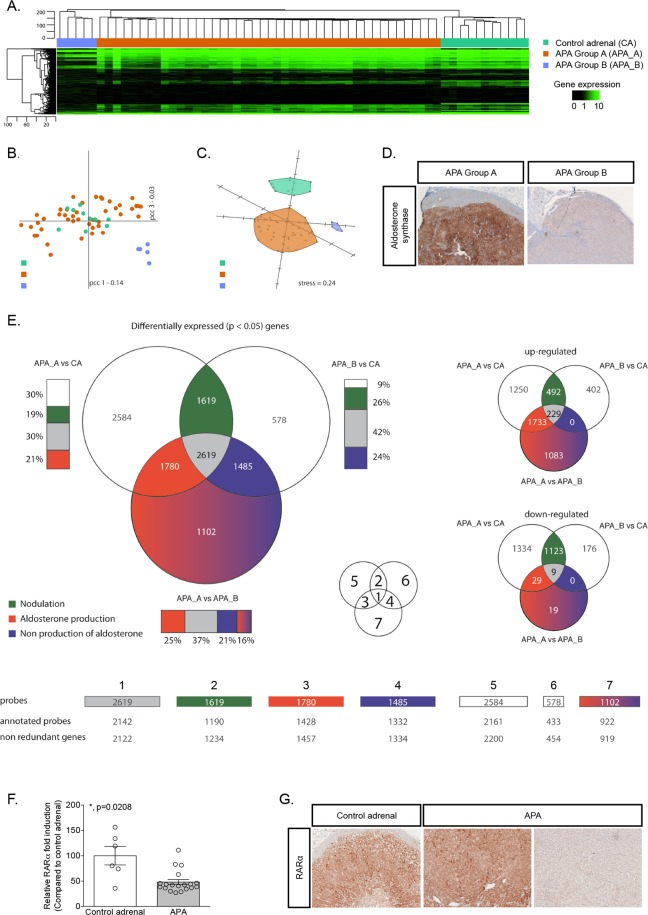
Figure 1.
Transcriptome analysis reveals two distinct subgroups of APA. (A) Hierarchical clustering using Euclidean distance and complete linkage of 48 APA and 11 control adrenals. Heat-map of the whole gene expression is displayed using black for low expression and green for high expression. (B) Principal Component Analysis in the correlation space over the entire transcriptome. The first two principal components and their associated inertia are displayed. (C) Singular-value-decomposition-initialized multidimensional scaling under the correlation space over all genes86,87. Kruskal error is indicated as “stress”. (D) Aldosterone synthase immunohistochemistry performed on adrenals from APA_A and APA_B. (E) Three groups (APA_A, APA_B and CA) are pair-wise compared to obtain a list of statistically significantly expressed candidate genes for each of the three comparisons. The common and comparison-specific genes are classified in seven different groups some of which are associated to a biological process. Venn-diagrams are displayed for statistically significantly differentially expressed candidate genes. The smaller Venn diagrams on the right-hand side of the figure represent the overlap for up-regulated and down-regulated genes. Bars are displayed next to the represented sets to indicate the relative proportion of the overlapping regions to the corresponding list of candidate genes. Figures displayed are the number of genes that populate each of the selected sets. (F) Expression of RARα was investigated by RT-qPCR on mRNA extracted from 6 control adrenals and 19 APA. Values are presented as the mean ± SEM; p values were calculated using a two-sided Mann-Whitney test. *p < 0.05. (G) RARα immunohistochemistry performed on control adrenal and in APA.

