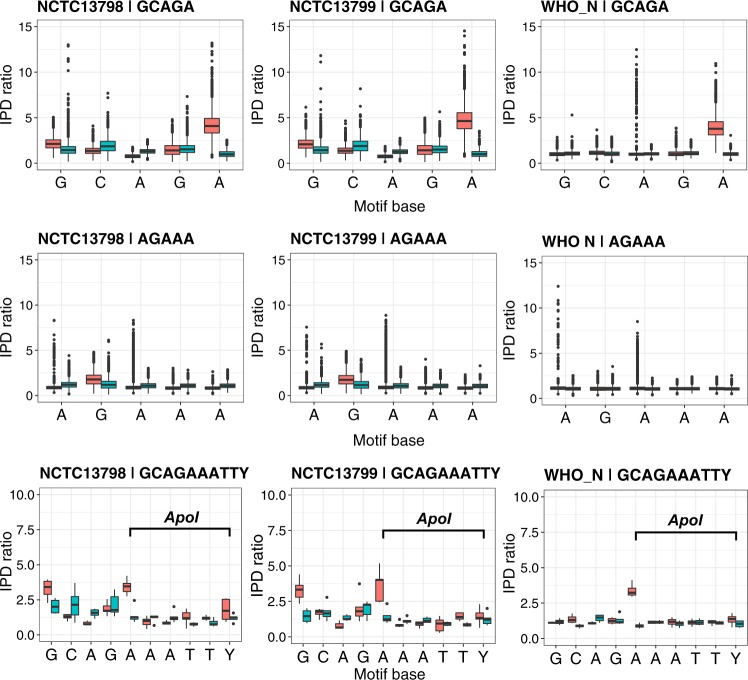
Figure 4.
Comparison of the per-base distribution of IPD ratios for the 5′-GCAGA-3′ motif detected in three strains as associated with NgoAXII, the distributions for the previously inferred 5′-AGAAA-3′ and the motif overlapping between the previous two and the recognition pattern of the ApoI restriction enzyme, 5′-RAATTY-3′2 in the three strains with a functional NgoAXII system. Two boxplots are shown per base, corresponding to the IPD ratios of the forward (red) and reverse (blue) strands.

