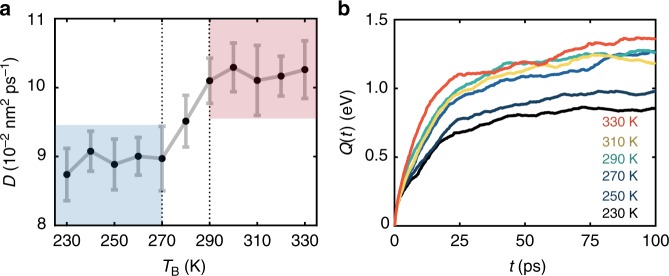
Fig. 2.
Benchmarks for thermal transport. a Heat diffusivity D along the major axis of helical Aib10 at increasing bath temperatures TB. Diffusivities are derived from the time tmax to reach the maximal temperature at each residue following a model tmax = d2/D, where d is the distance from the heater site. Colored regions denote low– (blue) and high–temperature (red) regimes (error bars are plus/minus one standard error). b Net heat Q(t) transferred from residue two to three versus simulation time and bath temperature, following the scheme of Eq. (1). Error bands for the maximal cumulative integration error, as well as net heat transfer between other residues, are in Supplementary Figs. 1–9

