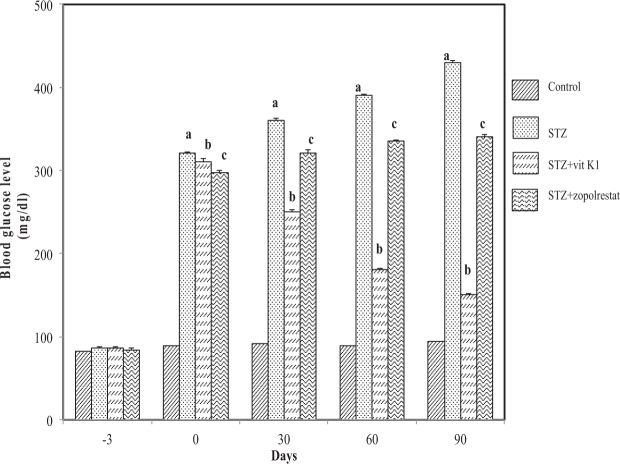
Figure 1.
Effect of vitamin K1 and zopolrestat on blood glucose. Values are mean ± SD of 5 determinations. Blood was collected from all treatment groups every month and processed for glucose measurement. ‘a’ indicates the difference observed between groups STZ and control and ‘b’ indicates the difference observed between STZ + vit K1 and STZ, ‘c’ indicates the difference between STZ + zopolrestat and STZ. All differences are statistically significant at P < 0.05.

