Fig. 3.
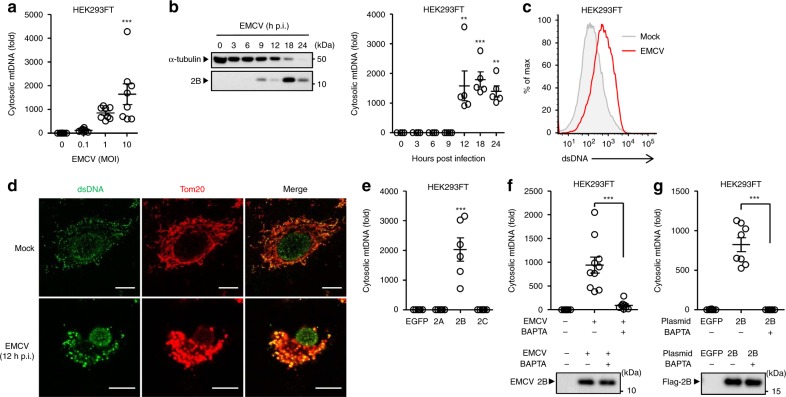
EMCV 2B protein stimulates cytosolic mtDNA release. a HEK293FT cells were infected with EMCV at indicated MOIs. Cytosolic mtDNA was assessed by quantitative PCR. b HEK293FT cells were infected with EMCV virus at MOI of 10. Cell lysates were collected at indicated time points and analyzed by immunoblotting with indicated antibodies (left panel). Cytosolic mtDNA was assessed by quantitative PCR (right panel). c HEK293FT were infected with EMCV. Cells were collected at 24 h post infection, and intracellularly stained with dsDNA-specific antibody (35I9 DNA). d STING-A549 cells were infected with EMCV. At 12 h post infection, cells were stained with anti-dsDNA (AC-30-10) and anti-Tom20 antibodies and analyzed by confocal microscopy. Scale bars, 10 μm. e HEK293FT cells were transfected with the expression plasmid encoding EGFP or Flag-EMCV 2A, 2B, or 2C protein. Cytosolic mtDNA was assessed by quantitative PCR at 24 h post transfection. f, g HEK293FT cells were infected with EMCV (f) or transfected with the expression plasmid encoding EGFP or Flag-tagged 2B protein (g) in the presence or absence of BAPTA (20 μM). Cell lysates were collected at 18 h post infection (f) or transfection (g) and analyzed by immunoblot with rabbit polyclonal antibody against EMCV 2B protein (f, lower panel) or mouse monoclonal antibody against Flag (g, lower panel). Cytosolic mtDNA was assessed by quantitative PCR at 18 h post infection (f, upper panel) or transfection (g, upper panel). These data are from three independent experiments (a, b, e–g; mean ± s.e.m.). **P < 0.01, ***P < 0.001; (one-way ANOVA and Tukey’s test). Source data are provided as a Source Data file

