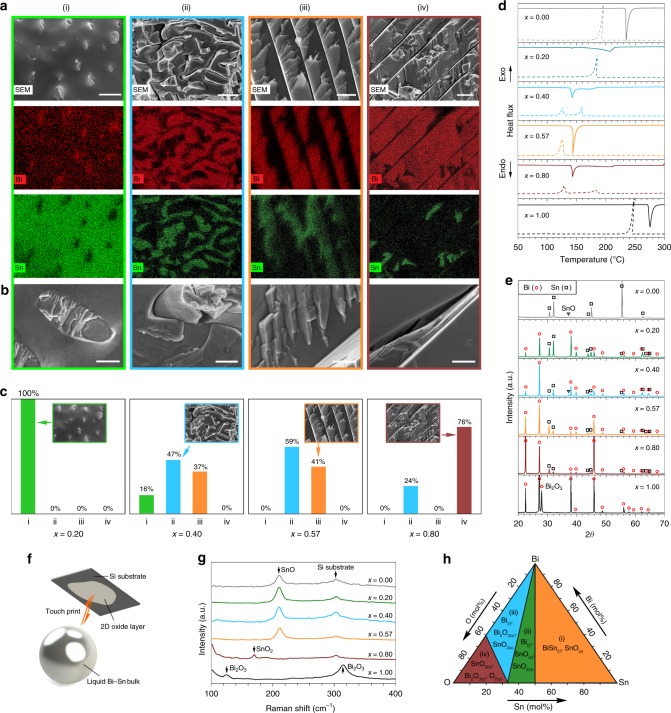
Fig. 2.
Characterisation of BixSn1-x bulk alloys. a SEM images and EDX element mappings showing the distribution of the Bi and Sn phases in four types of solidification structures observed in the Bi–Sn bulk alloys. Scale bars: (i) 2 µm; (ii) 5 µm; (iii) 2 µm; (iv) 5 µm. b Magnified views of different solidification structures. Scale bars: 500 nm. c Distribution of different solidification structures in different Bi–Sn bulk alloys. d DSC curves showing the melting (solid lines) and solidification (dash lines) trends of the bulk samples. e XRD patterns of the bulk samples. f Schematics of touch-printed surface oxide layer from liquid Bi–Sn bulk samples. g Raman spectra of the touch-printed surface oxide layers from bulk liquid Bi–Sn samples. h Phase diagram of the Bi–Sn–O system calculated at 300 °C, 1 atm

