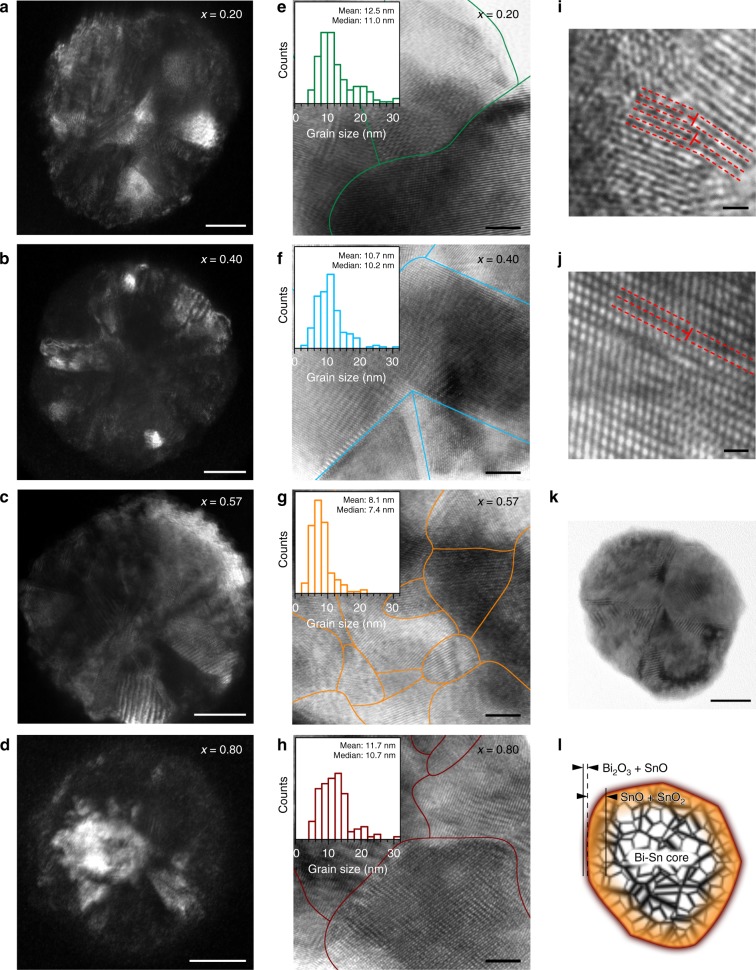
Fig. 5.
Crystallographic characterisation of the BixSn1−x nano-alloys. a–d DF-TEM images of individual particle of different Bi–Sn nano-alloy samples. Scale bars: 20 nm. e–h BF-HR-TEM images of the nano-alloys with their grain boundaries outlined. The insets present their respective grain size distribution. Scale bars: 5 nm. i, j BF-HR-TEM images showing line defects (edge dislocations) indicated by T-shape symbols that observed in the eutectic nano-alloys. Scale bars: 1 nm. k, l TEM image of a eutectic nano-alloy particle (k), scale bar: 20 nm, and an illustration shows its heterostructures based on the characterisation results (l)

