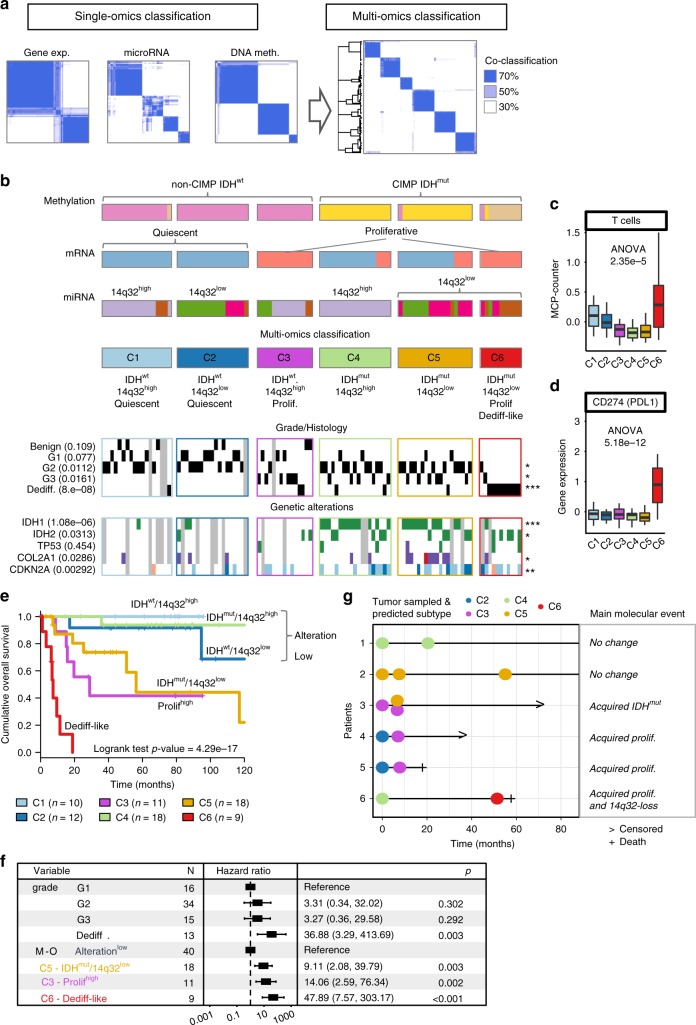
Fig. 4.
Multi-omics classification. a Schematic of a multi-omics classification of chondrosarcoma based on the three single-omics classifications. b Multi-omics classification of chondrosarcoma along each of the single-omics classification as well as its characterization using grading and histology features, and gene-specific genetic alterations. All of the 102 patient samples are represented as a column in the same order in each of the lines of the heatmaps. When relevant, the association between a feature shown as a heatmap and the 6-class multi-omics classification is shown (Student’s t-test for continuous variables or chi-squared test for discrete variables). Significance of an FDR correction of the p-values are shown on the right of each line using the following encoding: ***FDR < 0.1%, **FDR < 1%, *FDR < 5%, and no symbol for FDR > 5%. c Relative quantification of T lymphocytes cell population infiltration using MCP-counter and of d of the PDL1 immune checkpoints. Boxplots show the median, the first and third quartile and whiskers extend to 1.5 times the interquartile range. e Overall survival comparison of the 6-class multi-omics classification. f Forest plot of the multi-variate analysis of survival including grade and the multi-omics classification after the simplification of the three alteration low subtypes into one (C1, C2, and C4). g. Follow-up study of patients with mRNA profiled relapse sample. x-axis shows time after initial diagnosis and each dot corresponds to a sample, including the initial sample. Dots are colored depending on the mRNA-based multi-omics subtype prediction. The right panel summarizes the main molecular events identified in at least one the relapse sample as compared to the initial sample, if any. Dediff Dedifferentiated chondrosarcoma

