Fig. 4.
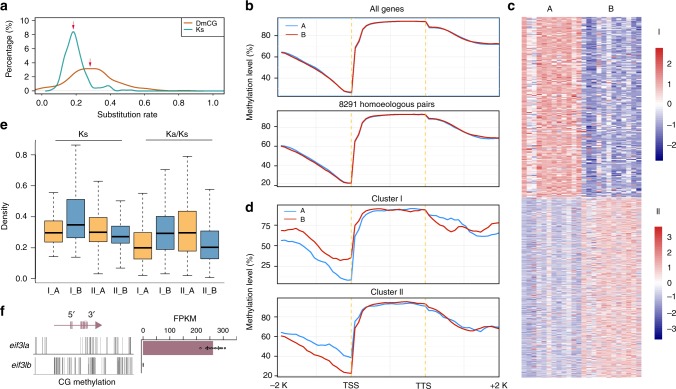
DNA methylation in homoeologous expression bias in C. carpio. a Distribution of synonymous substitution values (Ks) (blue) and gene-body DmCG percentages (red) of 2393 methylated homoeologous genes. Peak values are indicated by arrows. b CG methylation levels of all annotated genes and 8291 homoeologous gene pairs in two subgenomes. c Heatmaps of two extremely divergent co-expression clusters, of which one of two homoeologous genes in subgenomes A or B was extensively transcribed while the other copies suppressed in 12 tissues. d CG methylation levels of divergent expressed homoeologous genes corresponding to clusters I and II in c. e Boxplot of the Ka/Ks ratio distribution of homoeologous genes of two extremely divergent expression clusters in two subgenomes as shown in c. Yellow and blue boxplots indicate the genes in subgenomes A or B, respectively. f CG methylation level and expression level of homoeologous genes eif3I of C. carpio, which demonstrated that reduced CG methylation levels in the promotor region correlated with increased expression levels of eif3Ia, while eif3Ib was heavily methylated and silenced. FPKM reads per kilobases per million. Data represent mean ± sem for n = 9 expressed tissues

