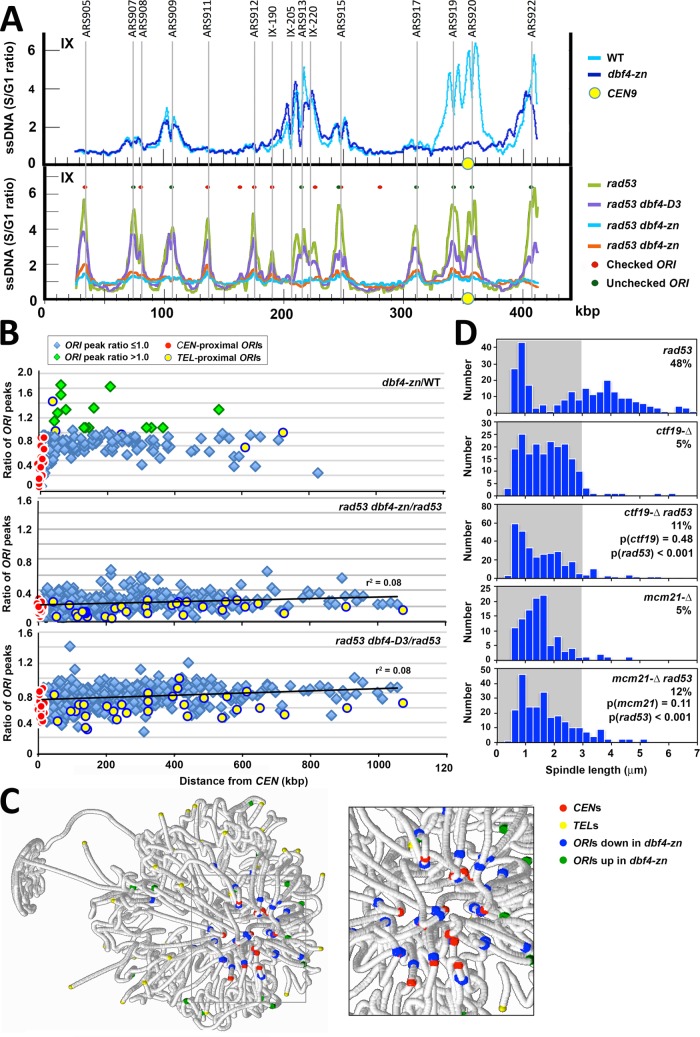
FIGURE 6:
ORI firing in HU-treated pdbf4-zn and rad53 pdbf4-zn mutants. dbf4-∆/pDBF4 (WT on figure; JJY108), dbf4-∆/pdbf4-zn (dbf4-zn on the figure; JJY181), rad53-21 dbf4-∆/pDBF4 (rad53 on the figure; JJY023), rad53-21 dbf4-∆/pdbf4-zn (rad53 dbf4-zn on the figure; JJY182), and rad53-21 dbf4-∆/pdbf4-D3 (rad53 dbf4-D3 on the figure; JJY029) strains were arrested in G1. The cultures were split with aliquots either released into 200 mM HU at 30°C or retained at the G1 block. After 60 min, ssDNA replication intermediates were isolated from G1 and HU-treated samples and hybridized to microarrays. The ratio of S phase (HU) to G1 hybridization values (S/G1 ratio) was determined at each array position. (A) Replication profiles for chromosome IX showing reduced firing of CEN-flanking ARS919 and ARS920 in pdbf4-zn (top profile) and more uniformly reduced ORI utilization in rad53-21 pdbf4-zn and rad53-21 pdbf4-D3 (bottom profile). (B) ORI AUCs were calculated for 177 ORI peaks in pDBF4 (WT) and pdbf4-zn strains treated with HU and 403 ORI peaks in rad53-21 pDBF4 (rad53) and rad53 pdbf4 strains treated with HU. The ratios of the pdbf4-zn to WT ORI AUCs, the rad53 pdbf4-zn to rad53 ORI AUCs, and the rad53 pdbf4-D3 to rad53 ORI AUCs (ratio of ORI peaks, y-axis) were plotted as a function of ORI distance to the CEN. CEN flanking ORIs, red circles; TEL proximal ORIs, yellow circles; ORIs with ORI AUC ratios ≥1.0, green diamonds. Regression lines are shown for rad53 plots. (C) pdbf4-zn ORIs decreased (blue) or increased (green) by ≥3 SD from the median difference between pdbf4-zn and pDBF4 peak amplitude values are highlighted (RasMol) on a spatial map of the yeast nucleus (see also Supplemental Table S3). Positions of CENs (red) and TELs (yellow) are also shown. Down-regulated ORIs in HU-treated pdbf4-zn cells tend to be located in close proximity to the CEN/SPB cluster, while up-regulated ORIs are often located somewhat more distally (inset). (D) The rad53-21 (JBY2274), ctf19-∆ (JBY2250), ctf19-∆ rad53-21 (JBY2251), mcm21-∆ (JBY2327), and mcm21-∆ rad53-21 (JBY2330) SPC42-GFP strains were released from G1 into 200 mM HU at 30°C. Spindle lengths were measured after 90 min. Percentages of cells with spindles ≥3 μm are shown, along with p values (two-tailed t test) for indicated comparisons.

