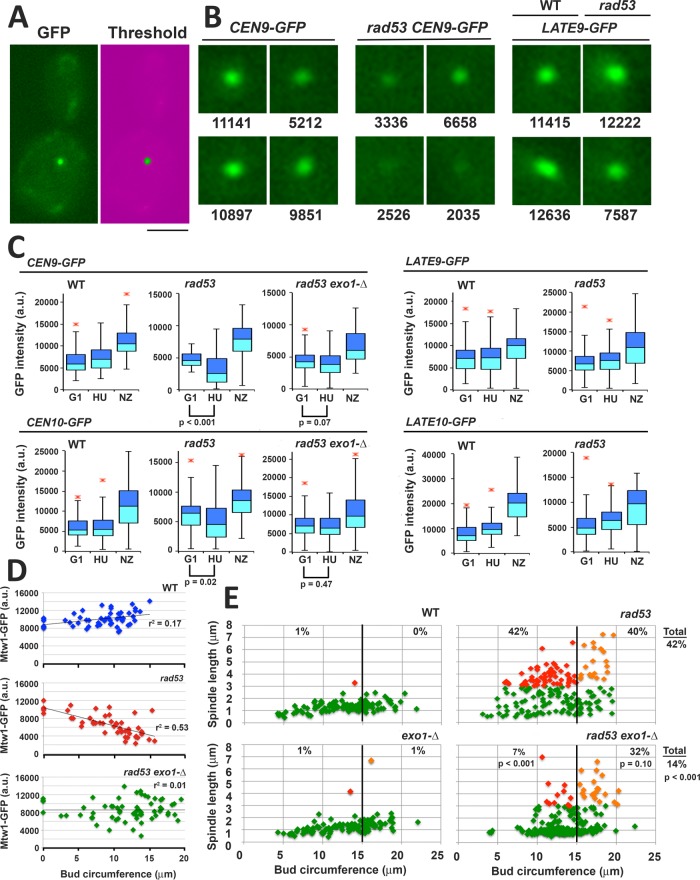
FIGURE 8:
Exo1 is a determinant of CEN/K integrity and spindle extension in HU-treated rad53 mutants. Strains harboring the indicated GFP chromosome tags were released from G1 into media containing 200 mM HU or with 15 μg/ml NZ at 30°C: CEN9-GFP (WT, JBY2283; rad53-21, JBY2295; exo1-∆ rad53-21, JBY2299); CEN10-GFP (WT, JBY2297; rad53-21, JBY2298; exo1-∆ rad53-21, JBY2301); LATE9-GFP (WT, JBY2289; rad53-21, JBY2290); LATE10-GFP (WT, JBY2291; rad53-21, JBY2293). Cells were processed for microscopy after 90 min. (A) Example of low-end mask to threshold GFP signal. Bar, 4 μm. (B) Representative CEN9-GFP and LATE9-GFP foci in HU-treated cells, with corresponding intensity values (arbitrary units). (C) Box plots of GFP tag intensities in G1, HU, and NZ arrested cells. At least 50 cells were analyzed for G1 and NZ samples; 100 cells were analyzed for HU samples. The p values (two-tailed t test) are provided in cases where the signal intensity of the HU sample is reduced compared with the G1 sample. (D) WT (JBY2252), rad53-21 (JBY2253), and exo1-∆ rad53-21 (JBY2264) MTW1-GFP strains were released from G1 into media containing both HU and NZ at 30°C. NZ was included so that Ks were not dispersed by spindle extension, facilitating quantification of Mtw1-GFP. After 90 min, live cell mounts were analyzed for Mtw1-GFP intensity. Bud circumference was measured as a proxy for time post-G1 release. Cells that did not leave the G1 block were scored to provide a signal baseline. Regression lines and fit estimates are indicated. (E) WT (JBY1129), rad53-21 (JBY1274), exo1-∆ (JBY2246), and exo1-∆ rad53-21 (JBY2303) SPC42-GFP strains were treated with HU as in A and evaluated for bud circumference and spindle length. Color coding: cells with spindles <3 μm, green; cells with spindles ≥3 μm and bud circumferences <15 μm (small to medium budded cells), red; cells with spindles ≥3 μm and buds ≥15 μm (medium to large budded cells), orange. The percentages of small/medium and medium/large budded cells with extended spindles are shown on the corresponding regions of the graphs. The total percentage rad53 and rad53 exo1 cells with extended spindles is shown on the right-hand side of the graphs. The p values (two-tailed t tests) compare differences in spindle extension between the rad53 and rad53 exo1 data sets.

