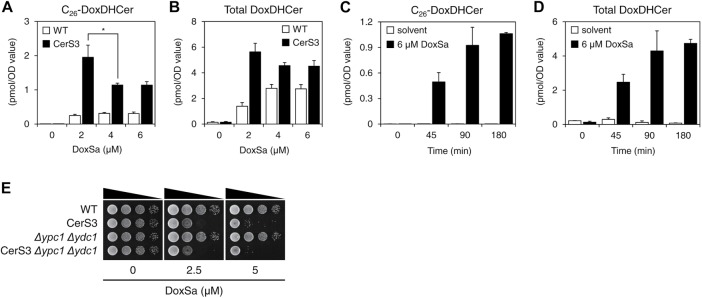
FIGURE 7:
The rate of DoxSa accumulation determines the level of DoxDHCer accumulation. Levels of C26-DoxDHCer (A) and total DoxDHCer (B) in WT and the CerS3 strain following the standardized DoxSa treatments (indicated concentrations of DoxSa, 1 million cells/ml, 1.5 h) determined by MS; n = 3. (C, D) Levels of C26-DoxDHCer (C) and total DoxDHCer (D) in the CerS3 strain monitored by a time-course lipid analysis by MS following a DoxSa treatment at 6 μM for up to 3 h; n = 2. (E) Effect of DoxSa on the growth of the indicated strains evaluated by a spot assay. Deletion of ceramidase (Δypc1 Δydc1) did not modulate the sensitivity of the CerS3 strain to DoxSa, indicating that the accumulation of DoxDHCer is independent of ceramidase.

