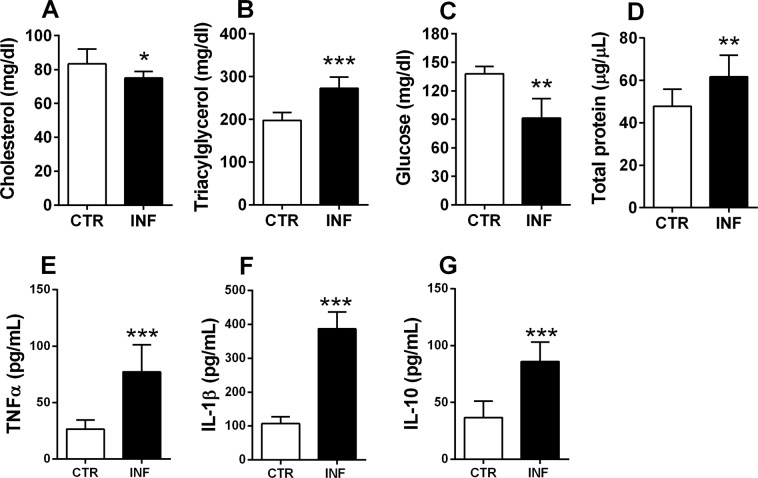
Figure 1.
Plasma analysis of P. chabaudi infected mice. (A) Total cholesterol, (B) triacylglycerol, and (C) glucose concentrations obtained using enzymatic colorimetric assays. (D) Total protein concentration measured by the Lowry method. (F–H) TNFα, IL-1β, and IL-10 concentration measured by ELISA. White bars indicate control (CTR, n = 14) and black bars indicate infected (INF, n = 14) groups. Statistical analyses: unpaired Student’s t-test. Values are presented as mean ± standard error. *p < 0.05, **p < 0.01, and ***p < 0.001.

