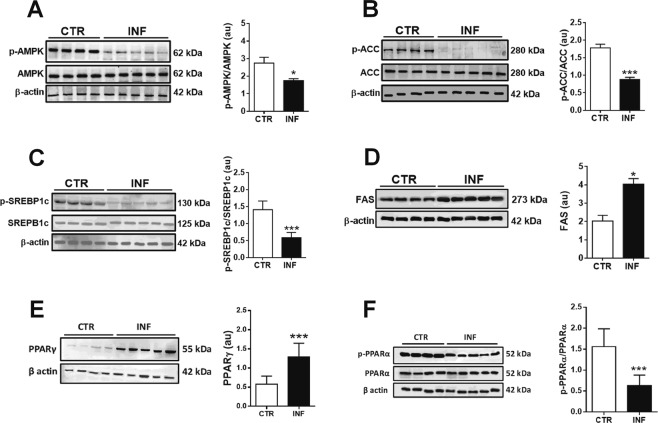
Figure 4.
Protein expression of key enzymes and transcription factors involved in lipid metabolism in the liver of mice infected with P. chabaudi. Representative immunoblots and the quantification of phosphoprotein (p) and/or total protein levels of AMPK (A), ACC (B), SREBP-1c (C), FAS (D), PPARα (E), and PPARγ (F). β-Actin was used as loading controls. Images represents cropped blots of the same membrane. Cropped slices are showed on Supplementary Information (S1). White bars indicate control (CTR, n = 14) and black bars indicate infected (INF, n = 14) groups. Statistical analyses: unpaired Student’s t-test. Values are presented as mean ± standard error. *p < 0.05 and ***p < 0.001.

