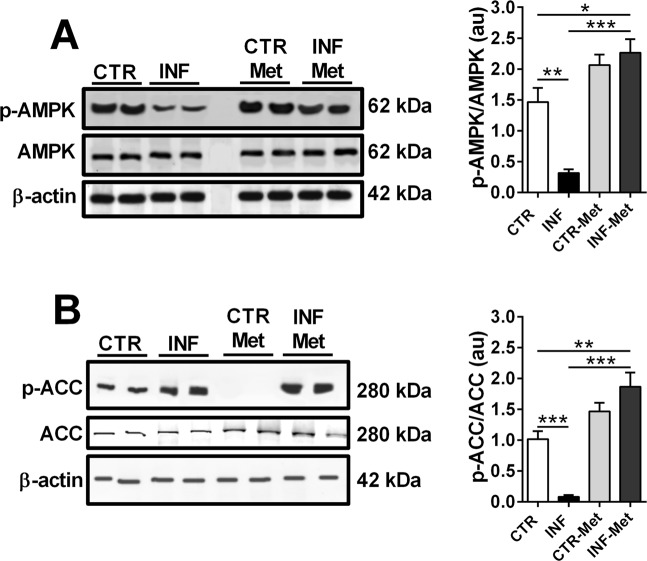
Figure 5.
Effect of metformin pretreatment on the protein expression of AMPK and ACC in the liver of mice infected with P. chabaudi. Representative immunoblots and quantification of phosphorylation levels of AMPK (A) and ACC (B). Images represents cropped blots of the same membrane. Cropped slices are showed on Supplementary Information (S2). White bars indicating control (CTR, n = 9), black bars indicate infected (INF, n = 9), light gray bars indicate metformin pretreated control (CTR-Met, n = 9), and dark gray bars indicate metformin pretreated infected (INF-Met, n = 7) groups. Statistical analyses: one-way ANOVA followed by Dunnett’s multiple comparisons test. Values are presented as mean ± standard error. ***p < 0.001.

