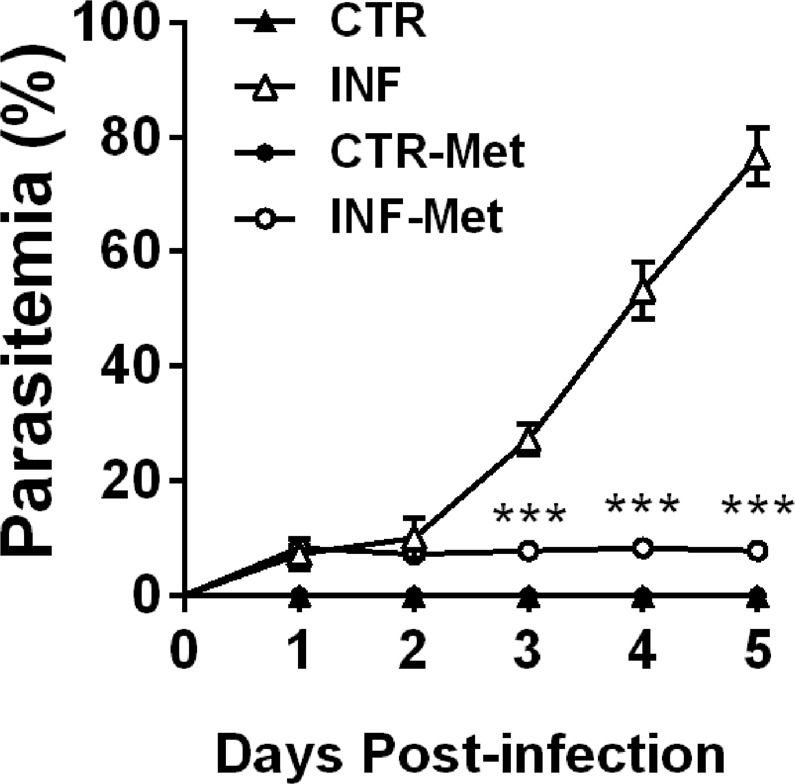
Figure 6.

Effect of metformin pretreatment on the effectiveness of P. chabaudi infection in mice. Percentage parasitemia assessed through evaluation of blood smears every day until the 5th day after infection. Closed triangles represent controls (n = 9), closed circles represent metformin pretreated controls (n = 9), open triangles represent the infected group (n = 9), and open circles represent the infected group pretreated with metformin (n = 7). Statistical analysis: two-way ANOVA followed by Tukey’s multiple comparisons test. Values are presented as mean ± standard error. ***p < 0.001.
