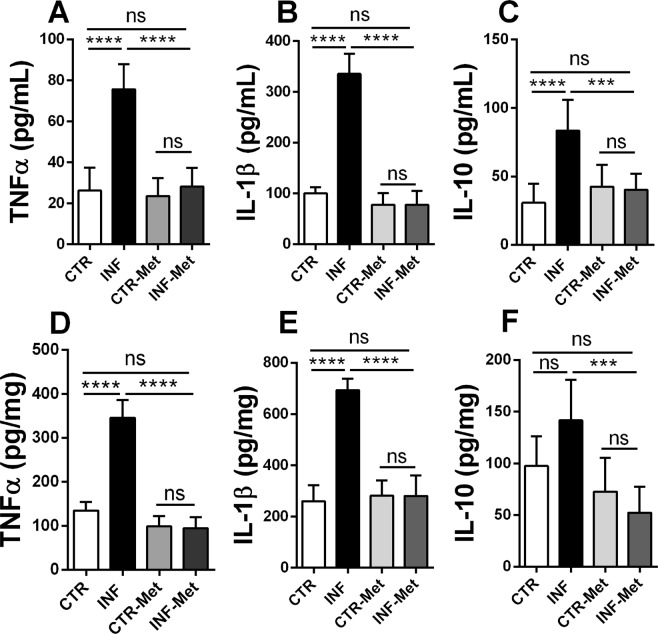
Figure 8.
Effect of pretreatment of metformin on cytokines profile measured on plasma and liver of Swiss mice. The graphs shows the concentration of TNFα, IL-1β, and IL-10 obtained by ELISA assay. White bars indicate controls (CTR, n = 9), black bars indicate the infected group (INF, n = 9), light gray bars indicate the metformin pretreated controls (CTR-Met, n = 9), and dark gray bars indicate the metformin pretreated infected group (INF-Met, n = 7). Statistical analyses: one-way ANOVA followed by Dunnett’s multiple comparisons test. Values are presented as mean ± standard error. **p < 0.01 and ***p < 0.001.

