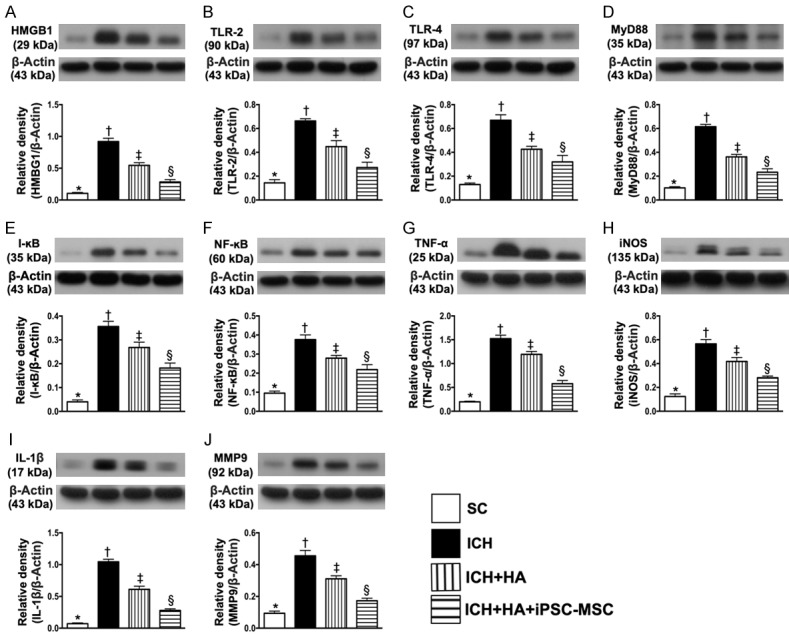
Figure 5.

Protein expressions of DAMP-inflammatory signaling pathway in brain tissue by day 14 after ICH procedure. A. Protein expression of high-mobility group protein 1 (HMGB1), * vs. other groups with different symbols (†, ‡, §), P<0.0001. B. Protein expression of toll-like receptor (TLR)-2, * vs. other groups with different symbols (†, ‡, §), P<0.0001. C. Protein expression of TLR-4, * vs. other groups with different symbols (†, ‡, §), P<0.0001. D. Protein expressions of myeloid differentiation primary response 88 (MyD88), * vs. other groups with different symbols (†, ‡, §), P<0.0001. E. Protein expression of I-κB, * vs. other groups with different symbols (†, ‡, §), P<0.0001. F. Protein expression of nuclear factor (NF)-κB, * vs. other groups with different symbols (†, ‡, §), P<0.0001. G. Protein expression of tumor necrosis factor (TNF-α), * vs. other groups with different symbols (†, ‡, §), P<0.0001. H. Protein expression of inducible nitric oxide synthase (iNOS), * vs. other groups with different symbols (†, ‡, §), P<0.0001. I. Protein expression of interleukin (IL)-1β, * vs. other groups with different symbols (†, ‡, §), P<0.0001. J. Protein expression of matrix metalloproteinase (MMP)-9, * vs. other groups with different symbols (†, ‡, §), P<0.0001. All statistical analyses were performed by one-way ANOVA, followed by Bonferroni multiple comparison post hoc test (n=6 for each group). Symbols (*, †, ‡, §) indicate significance (at 0.05 level). SC = sham-operated control; ICH = intracranial hemorrhage; HA = hyaluronic acid; iPSC-MSC = induced pluripotent stem cell-derived mesenchymal stem cell.
