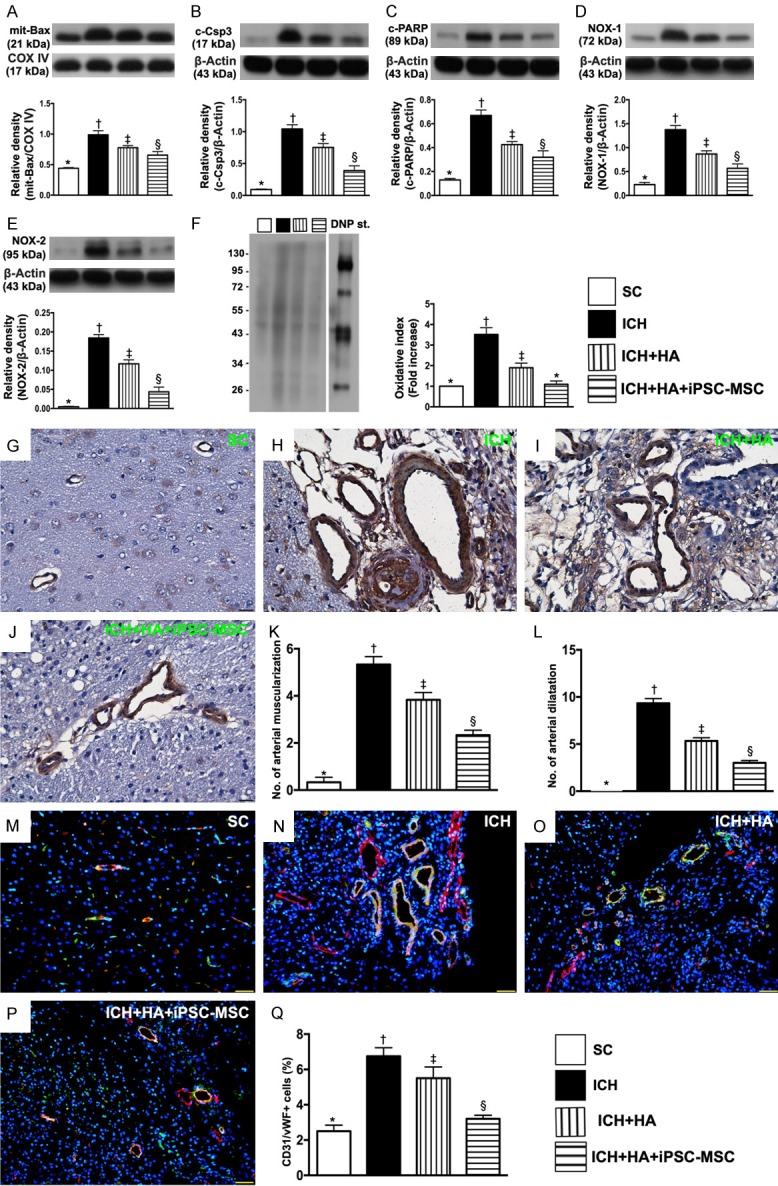
Figure 6.

The protein expressions of oxidative-stress and apoptotic biomarkers in brain tissue, and the numbers of arterial muscularization/dilatation and endothelial cell markers in brain hematoma zone by day 14 after ICH procedure. A. The protein expressions of mitochondrial (Mito) Bax, * vs. other groups with different symbols (†, ‡, §), P<0.0001. B. Protein expression of cleaved caspase 3 (c-Csp-3), * vs. other groups with different symbols (†, ‡, §), P<0.0001. C. Protein expression of cleaved Poly (ADP-ribose) polymerase (c-PARP), * vs. other groups with different symbols (†, ‡, §), P<0.0001. D. Protein expression of NOX-1, * vs. other groups with different symbols (†, ‡, §), P<0.0001. E. Protein expression of NOX-2, * vs. other groups with different symbols (†, ‡, §), P<0.0001. F. Oxidized protein expression, * vs. other groups with different symbols (†, ‡, §), P<0.0001. (Note: left and right lanes shown on the upper panel represent protein molecular weight marker and control oxidized molecular protein standard, respectively). M.W = molecular weight; DNP = 1-3 dinitrophenylhydrazone. G-J. Illustrating microscopic finding (400 ×) of α-smooth muscle actin (α-SMA) staining for identification of arterial muscularization (red arrows) and arterial dilatation (yellow arrows). K. Analytical result of number of arterial muscularizations, * vs. other groups with different symbols (†, ‡, §), P<0.0001. L. Analytical result of number of arterial dilatations, * vs. other groups with different symbols (†, ‡, §), P<0.0001. M-P. Illustrating immunofluorescent (IF) microscopy (400 ×) for identification of positively stained CD31/von Willebrand factor (CD31/vWF+) cells in vessels, i.e., double stain of green-yellow color. Q. Analytical result of number of CD31/vWF+ cells, * vs. other groups with different symbols (†, ‡, §), P<0.001. Scale bars in the right lower corner represent 20 µm. All statistical analyses were performed by one-way ANOVA, followed by Bonferroni multiple comparison post hoc test (n=6 for each group). Symbols (*, †, ‡, §) indicate significance (at 0.05 level). SC = sham-operated control; ICH = intracranial hemorrhage; HA = hyaluronic acid; iPSC-MSC = induced pluripotent stem cell-derived mesenchymal stem cell.
