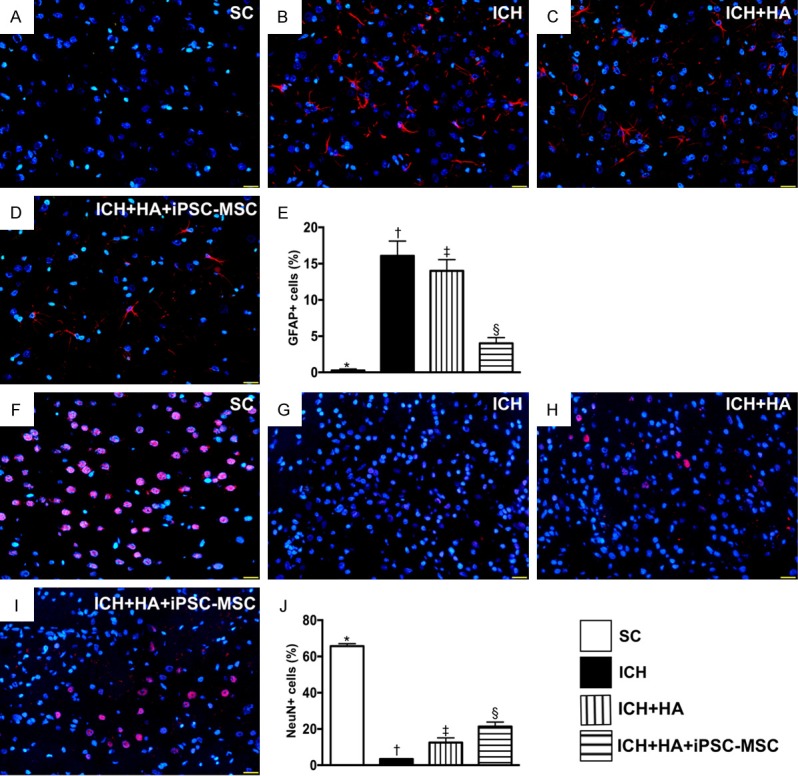
Figure 7.

Expressions of glial cells and NeuN cells in brain tissue by day 14 after ICH procedure. A-D. Illustrating immunofluorescent (IF) microscopy (400 ×) for identification of glial fibrillary acid protein (GFAP)+ cells (red color). E. Analytic result of number of GFAP+ cells, * vs. other groups with different symbols (†, ‡, §), P<0.0001. F-I. Illustrating IF microscopy (400 ×) for identification of NeuN+ cells (pink color). J. Analytic result of number of GFAP+ cells, * vs. other groups with different symbols (†, ‡, §), P<0.0001. Scale bars in right lower corner represent 20 µm. All statistical analyses were performed by one-way ANOVA, followed by Bonferroni multiple comparison post hoc test (n=6 for each group). Symbols (*, †, ‡, §) indicate significance (at 0.05 level). SC = sham-operated control; ICH = intracranial hemorrhage; HA = hyaluronic acid; iPSC-MSC = induced pluripotent stem cell-derived mesenchymal stem cell.
