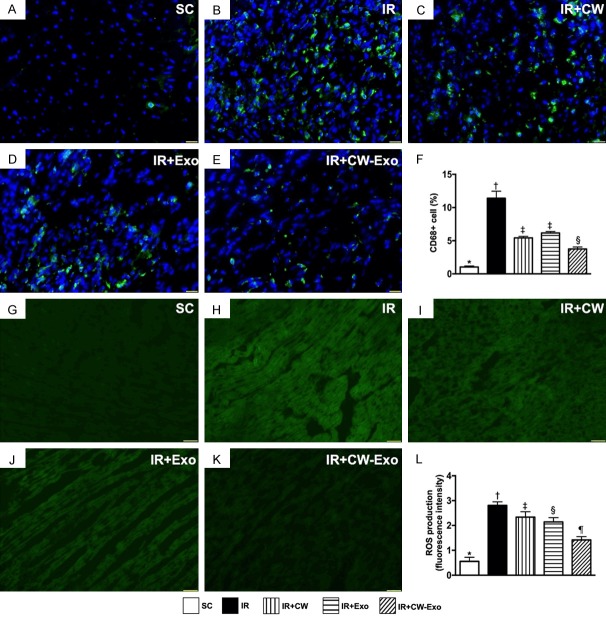
Figure 3.
Inflammatory cell infiltration and ROS in LV myocardium by day 5 after IR procedure. A-E. Illustrating the immunofluorescent (IF) microscopic finding (400 ×) for identification of CD68+ cells (green color). F. Analytical result of number of positively stained CD68 cells, * vs. other groups with different symbols (†, ‡, §), P<0.0001. Scale bars in lower right corner represent 20 µm. G-K. Illustrating the IF microscopic finding (400 ×) for identification of fluorescent intensity of H2DCFDA stain [i.e., an indicator of tissue reactive oxygen species (ROS)] (green color). L. Analytical result of fluorescent intensity ROS in kidney tissue, * vs. other groups with different symbols (†, ‡, §, ¶), P<0.0001. All statistical analyses were performed by one-way ANOVA, followed by Bonferroni multiple comparison post hoc test (n=6 for each group). Symbols (*, †, ‡, §, ¶) indicate significance (at 0.05 level). SC = sham-operated control; IR = ischemia reperfusion; CW = cold water; Exo = adipose-derived mesenchymal stem cell-derived exosome.

