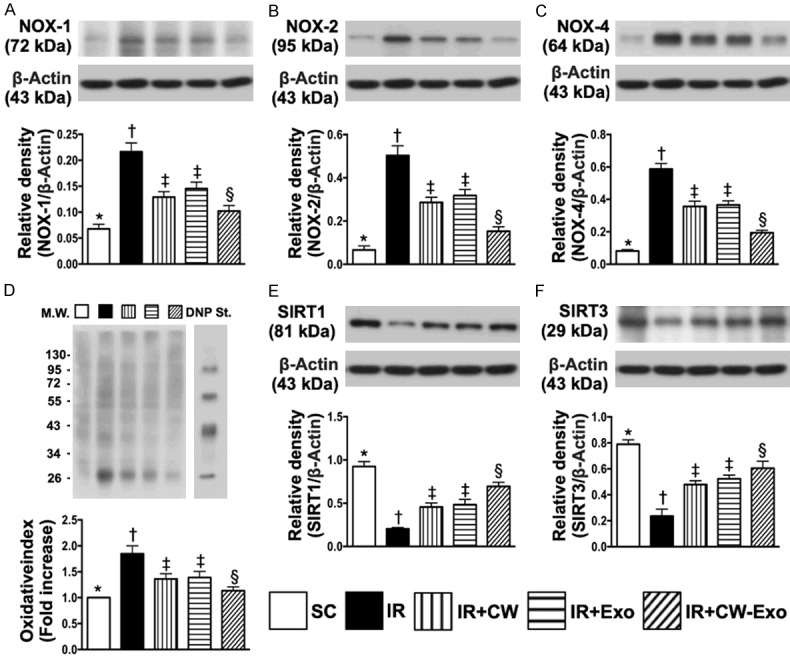
Figure 5.

The protein expressions of oxidative stress and antioxidants in LV myocardium by day 5 after IR procedure. A. Protein expression of NOX-1, * vs. other groups with different symbols (†, ‡, §), P<0.0001. B. Protein expression of NOX-2, * vs. other groups with different symbols (†, ‡, §), P<0.0001. C. Protein expression of NOX-4, * vs. other groups with different symbols (†, ‡, §), P<0.0001. D. The oxidized protein expression, * vs. other groups with different symbols (†, ‡, §), P<0.0001 (Note: the right and left lanes shown on the upper panel represent protein molecular weight marker and control oxidized molecular protein standard, respectively). M.W = molecular weight; DNP = 1-3 dinitrophenylhydrazone. E. Protein expression of SIRT1, * vs. other groups with different symbols (†, ‡, §), P<0.0001. F. Protein expression of SIRT3, * vs. other groups with different symbols (†, ‡, §), P<0.0001. All statistical analyses were performed by one-way ANOVA, followed by Bonferroni multiple comparison post hoc test (n=6 for each group). Symbols (*, †, ‡, §) indicate significance (at 0.05 level). SC = sham-operated control; IR = ischemia reperfusion; CW = cold water; Exo = adipose-derived mesenchymal stem cell-derived exosome.
