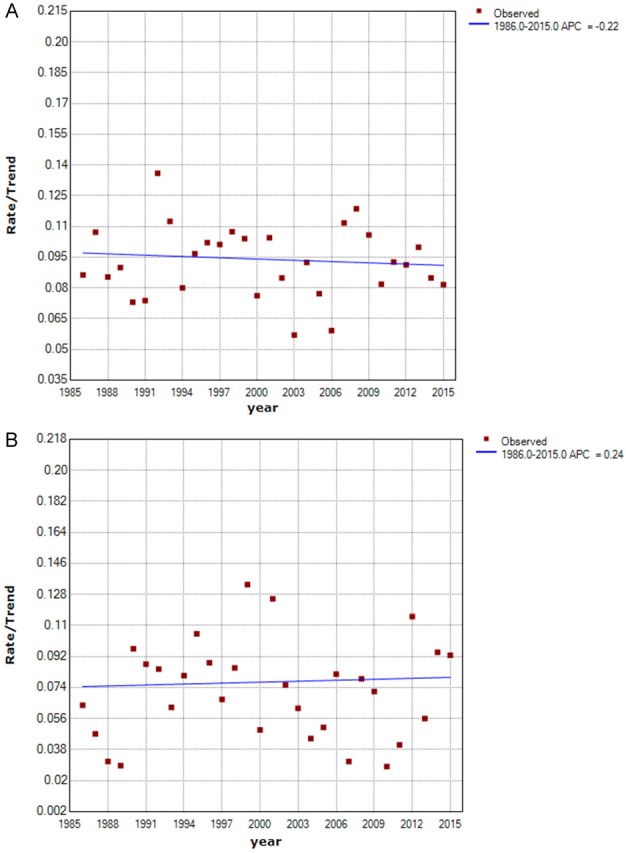
Figure 1.

Curve of the Standardized Incidence from 1986 to 2015. A. Curve of Standardized Incidence. B. Curve of Truncated Incidence. The truncated incidence was counted among 35-64-year-old patients. The points indicate the observed incidence (per 100,000 person-years). The fitting curve shows the annual percentage change in standardized incidence from 1986 to 2015. Rates are age-adjusted to the 2000 US standard population.
